

说明
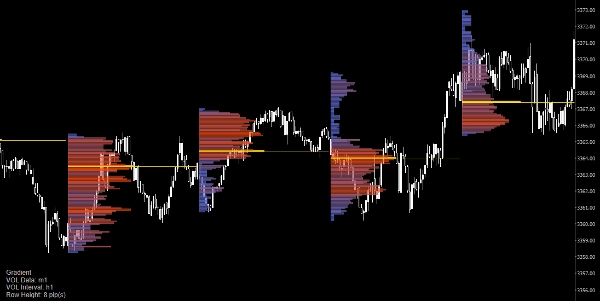
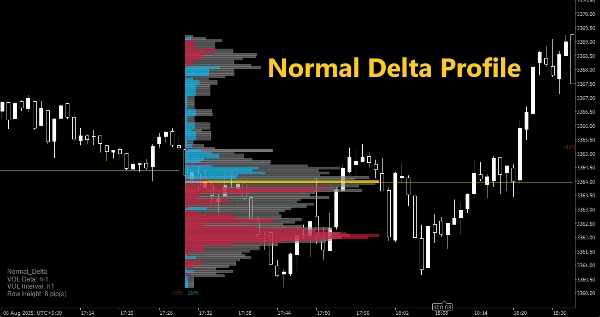
通过这个完全可定制的成交量分布指标,解锁更深入的市场洞察。在任何时间框架内可视化成交量分布,支持可调节的行高、价格和时间间隔以及颜色渐变。突出显示关键买卖水平,跟踪拍卖高低点,并叠加实时Delta分布,以评估激进买入与卖出压力。
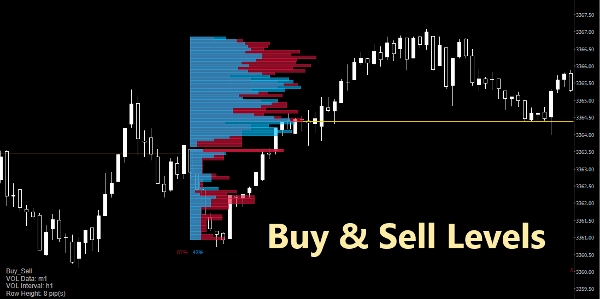
无论您是波段交易还是剥头皮交易,都可以在多种分布类型之间切换——标准、买卖盘、Delta——并根据图表主题调整外观。多时间框架支持让您并排比较会话、日线和自定义区间分布。非常适合一目了然地发现价值区、成交量控制点和不平衡。
摘要
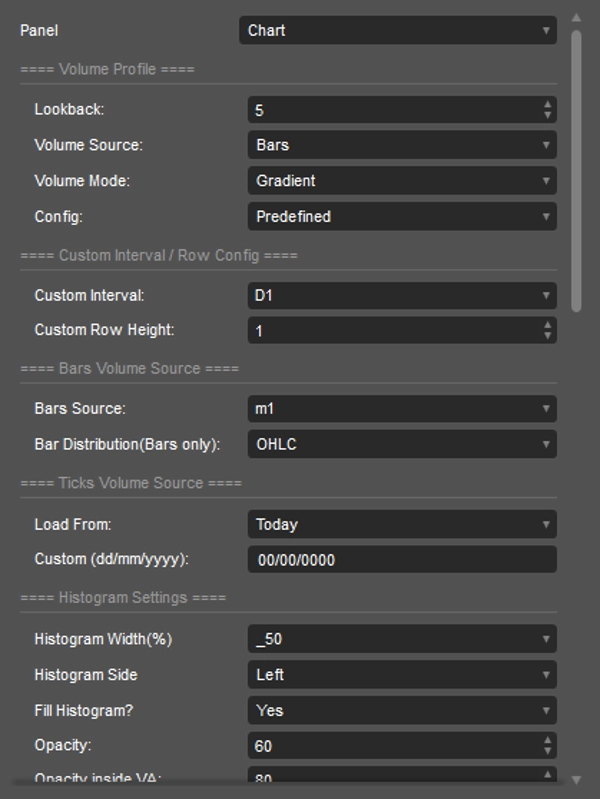
指标配置
客户评价
0.0
评价:0
客户评价
该产品尚无评价。已经试过了?抢先告诉其他人!
讨论
常见问答
cTrader Store 提供的所有产品,包括交易机器人、指标和插件,均由第三方开发者提供,仅供信息参考和技术访问之用。cTrader Store 并非经纪商,不提供投资建议、个人推荐或任何未来业绩保证。
该作者的其他作品


价格
注册日期 14/03/2025
23
销售