
説明
MFI-MTF: マルチタイムフレーム・マネーフローインデックス
概要
MFI-MTFは、現在のチャートにより高い時間軸の視点をもたらすマルチタイムフレームのモメンタム指標です。より大きな時間軸でマネーフローインデックス(MFI)を計算し、それを作業中のチャートに表示することで、この指標は時間軸を手動で切り替えることなく、複数の市場視点にわたる買われ過ぎ・売られ過ぎの状態を特定するのに役立ちます。
機能
マネーフローインデックス分析: この指標は価格の動きと取引量の両方を分析して買い圧力と売り圧力を測定します。0から100の間で振動し、資産が過剰な買い(買われ過ぎ)または売り(売られ過ぎ)の圧力を受けているかを識別します。
高時間軸の文脈: 現在のチャート時間軸でMFIを計算するのではなく、MFIMTFは指定したより大きな時間軸(日足、週足、4時間足など)からデータを取得します。これにより、低い時間軸のノイズなしに機関投資家レベルのモメンタムの洞察を得られます。例えば、日足のMFIが買われ過ぎを示す場合、より大きなトレンドが疲弊に近づいていることがわかり、エントリーやエグジットの判断に有益な文脈を提供します。
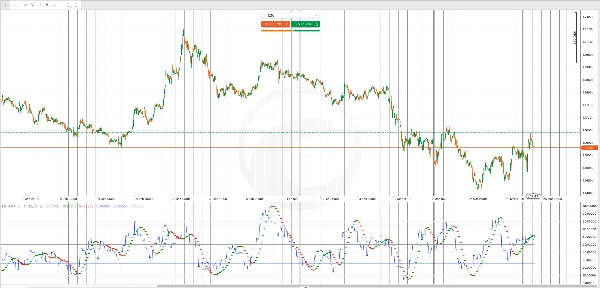
ハル移動平均フィルター: MFIに適用されたハル移動平均(HMA)は、騙しを平滑化し、方向性のモメンタム変化を強調します。緑の点はモメンタムの上昇トレンドを示し、赤の点は下降トレンドを示し、モメンタム方向の変化を素早く視覚的に確認できます。
主な出力
MFIライン(青): 選択したより高い時間軸からの主要なマネーフローインデックス値で、現在のチャートの各バーに表示されます。
HMAシグナル(緑/赤のポイント): モメンタムが上昇しているときに緑のポイントが現れ、モメンタムが弱まるか下降に転じると赤のポイントが現れます。これらは潜在的な転換の早期警告信号として機能します。
参照レベル:
- 買われ過ぎレベル(デフォルト70): MFIがこれを超えると、買い圧力が過剰で反転が起こりやすくなります
- 売られ過ぎレベル(デフォルト30): MFIがこれを下回ると、売り圧力が枯渇し反発が起こりやすくなります
- 中間ライン(50): 強気と弱気のモメンタムの中立的な均衡点
カスタマイズ
時間軸の選択: 現在のチャートよりも高い任意の時間軸を選択してください(例えば1時間足のチャートで日足)。大きな時間軸はより広いトレンドの文脈を提供しますがシグナルは少なくなり、小さな単位はより多くの取引機会を提供しますが戦略的な視点は薄れます。
MFI期間: マネーフローインデックスの参照期間を調整します(デフォルト14)。短い期間は最近の出来高変化により敏感に反応し、長い期間は変動を平滑化し誤信号を減らします。
HMA期間: モメンタムフィルターの平滑化を制御します。短い期間はトレンド変化をより明確にしますがノイズが多く、長い期間はトレンドをより確実に確認しますがシグナル生成が遅くなります。
買われ過ぎ/売られ過ぎの閾値: これらのレベルを取引スタイルに合わせてカスタマイズしてください。保守的なトレーダーは75/25、積極的なトレーダーは80/20を使い、より極端な条件を待つことがあります。
実用的な使い方
MFI MTFを使ってエントリーとエグジットに確証を加えましょう。作業中の時間軸での売りシグナルは、日足のMFIがすでに買われ過ぎの場合、機関投資家の売りが活発であることを示し、より信頼性が高まります。同様に、より高い時間軸のMFIが売られ過ぎの場合、売り圧力がマクロレベルで枯渇していることを示し、買いシグナルの強さが増します。
HMAの色の変化はモメンタムの変化をリアルタイムで知らせ、損失トレードから早めに撤退したり、反転が激しくなる前にポジションサイズを減らすのに役立ちます。
概要
The indicator includes a Hull Moving Average (HMA) filter applied to the MFI to smooth out noise and highlight momentum shifts. Green dots indicate strengthening upward momentum, while red dots signal weakening or downward momentum. Reference levels include default overbought (70), oversold (30), and a neutral midpoint (50), all customizable to fit different trading styles.
Key outputs are the MFI line from the chosen higher timeframe and HMA signals for momentum direction changes. Adjustable parameters include the MFI lookback period, HMA smoothing period, and overbought/oversold thresholds. MFI-MTF aids in confirming entry and exit points by providing institutional-level momentum insights and real-time alerts to momentum shifts on your working chart.
カスタマーレビュー
5 | 100 % | |
4 | 0 % | |
3 | 0 % | |
2 | 0 % | |
1 | 0 % |


