설명
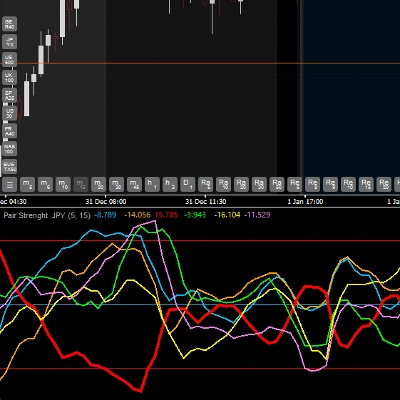
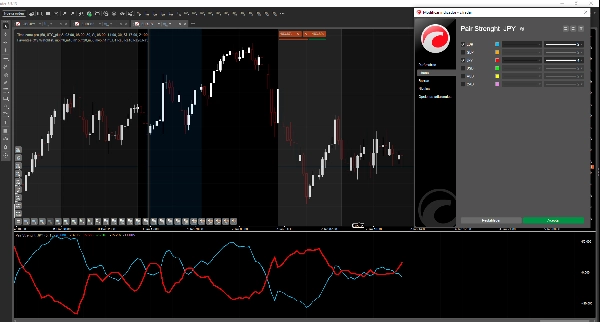
페어 강도 (JPY) - 통화 강도 지표
📊 페어 강도 (JPY)란?
페어 강도 (JPY)는 6대 주요 통화의 상대 강도를 실시간으로 분석하고 비교하는 고급 지표입니다: EUR, GBP, JPY, USD, AUD, 그리고 CAD. 각 통화의 모멘텀과 강도를 측정하기 위해 True Strength Index (TSI)를 사용하여 시장에서 어떤 통화가 더 강하거나 약한지 식별할 수 있습니다.
🎯 주요 기능
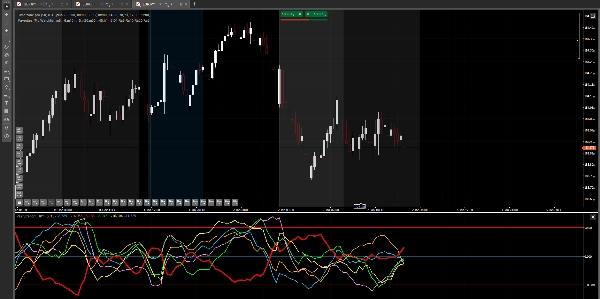
✅ 다중 통화 분석: 한 창에서 6개 통화를 동시에 모니터링 ✅ 추세 식별: 시장에서 가장 강하고 약한 통화 감지 ✅ 과매수/과매도 신호: 극단을 식별하기 위한 50, 0, -50 레벨 ✅ 거래 확인: 상대 강도를 비교하여 진입을 검증하는 데 도움 ✅ 시각적이고 명확함: 각 통화는 쉽게 식별할 수 있도록 고유 색상을 가짐
💹 호환 페어
중요: 이 지표는 6개 통화의 강도를 분석합니다: EUR, GBP, JPY, USD, AUD, 그리고 CAD
이 지표는 오직 JPY (일본 엔)가 포함된 페어에서만 작동합니다. 즉:
- EURJPY (유로 / 엔)
- GBPJPY (파운드 / 엔)
- USDJPY (달러 / 엔)
- AUDJPY (호주 달러 / 엔)
- CADJPY (캐나다 달러 / 엔)
⚠️ 이 지표가 제대로 작동하려면 브로커가 반드시 이 5개 JPY 페어를 제공해야 합니다.
다음과는 작동하지 않습니다:
- 금, 은 또는 기타 금속
- 주가지수
- 암호화폐
- JPY가 포함되지 않은 페어 (예: EURUSD, GBPUSD 등)
위에 언급된 5개 페어 중 어느 차트에든 이 지표를 적용할 수 있습니다.
📈 지표 사용법
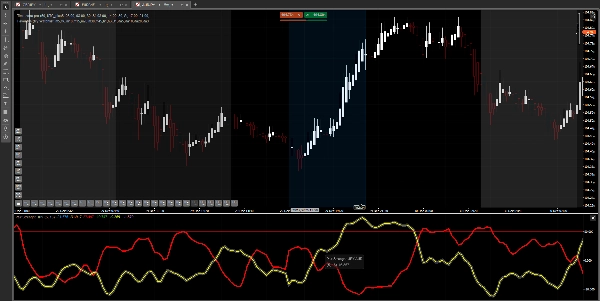
선 해석:
각 색깔 선은 통화의 강도를 나타냅니다:
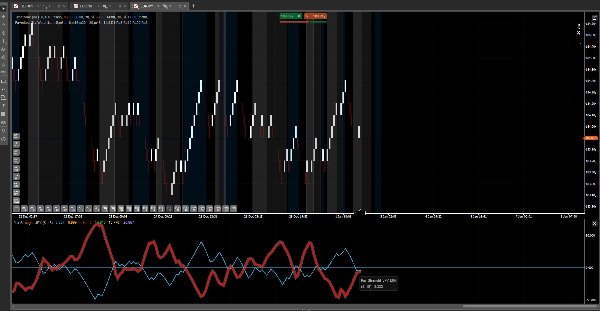
- 선이 위로 (양수 값): 통화가 강함
- 선이 아래로 (음수 값): 통화가 약함
- 선 교차: 통화 간 상대 강도 변화
주요 레벨:
- 레벨 50: 과매수 구역 - 통화가 매우 강하며 반전 가능성 있음
- 레벨 0: 중립선 - 강함과 약함의 균형
- 레벨 -50: 과매도 구역 - 통화가 매우 약하며 반전 가능성 있음
기본 전략:
- 가장 강한 통화 식별 (가장 높은 선)
- 가장 약한 통화 식별 (가장 낮은 선)
- 두 통화를 결합한 페어 거래 (예: EUR가 강하고 JPY가 약하면 → EURJPY 매수)
- 레벨로 확인: 강한 통화가 +50일 때 매수 피하고 약한 통화가 -50일 때 매도 피하기
⚙️ 조정 가능한 매개변수
- 빠른 기간 (기본값: 5): TSI의 빠른 기간 - 낮은 값일수록 민감함
- 느린 기간 (기본값: 15): TSI의 느린 기간 - 높은 값일수록 부드러움
기본값은 대부분 상황에 잘 작동합니다. 거래 스타일에 맞게 조정하세요.
🔮 향후 업데이트
사용자 반응과 피드백에 따라 향후 버전에서 더 많은 통화 페어(NZD, CHF 등)를 추가할 가능성을 평가 중입니다. 다만 이는 보장되지 않으며 지표 성능과 시장 수요에 따라 달라집니다.
💡 사용 팁
✓ 단독 시스템이 아닌 주요 전략과 함께 사용하세요 ✓ 가격 행동 분석 및 지지/저항 레벨과 결합하세요 ✓ 실거래 전 데모 계좌에서 먼저 연습하세요 ✓ 모든 신호가 성공하는 것은 아니므로 적절한 리스크 관리를 적용하세요 ✓ M15 이상 타임프레임에서 가장 잘 작동합니다
📞 지원
지표 설치나 사용에 관한 질문이 있으면 문의해 주세요.
최종 참고: 이 지표는 분석 도구입니다. 거래 성공은 리스크 관리, 심리, 경험 등 여러 요인에 달려 있습니다.
요약
This tool works exclusively with currency pairs that include the Japanese Yen (JPY), specifically EURJPY, GBPJPY, USDJPY, AUDJPY, and CADJPY. It does not support metals, stock indices, cryptocurrencies, or pairs without JPY. Users apply the indicator on any of the five JPY pairs to monitor multi-currency strength simultaneously in one window.
Adjustable parameters include the fast and slow periods of the TSI for sensitivity and smoothing. The indicator aids in trend identification, overbought/oversold signal detection, and trade confirmation by comparing relative currency strength. It is recommended for use alongside other analysis methods and on timeframes of 15 minutes or higher.
고객 리뷰
5 | 100 % | |
4 | 0 % | |
3 | 0 % | |
2 | 0 % | |
1 | 0 % |


