
설명
BB20 멀티컬러
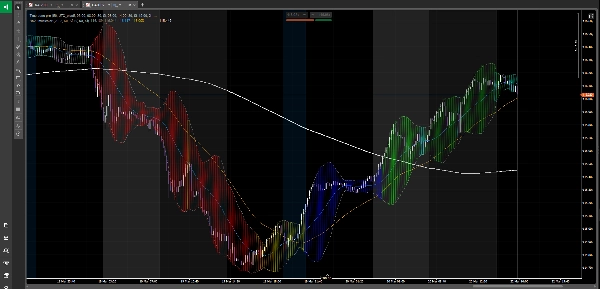
차트 위에 직접 오버레이되어 가격 움직임을 8가지 뚜렷한 시장 상태별로 색상 코딩하는 강력한 시장 주기 식별 지표입니다 — 깊은 약세에서 완전한 강세까지 — 가격과 네 가지 주요 이동평균선(MM20, MM50, MM100, MM200)과 볼린저 밴드의 관계를 결합하여 사용합니다.
──────────────────────────
작동 원리
──────────────────────────
이 지표는 가격이 네 가지 이동평균선에 대해 어떤 위치에 있는지 지속적으로 평가하며, 볼린저 밴드 클라우드 영역에 8가지 색상 중 하나를 할당하여 현재 시장 주기 단계를 즉시 시각적으로 파악할 수 있게 해줍니다:
🔴 빨강 — 명확한 약세 추세
가격이 MM200 아래에 있습니다. 시장은 매도자가 지배하고 있습니다. 편향: 숏만.
🟠 주황 — 기술적 반등
가격이 MM200 아래에 있지만 MM20 위로 회복했습니다. 약세 추세 내 반등이며 반전은 아닙니다. 일반적인 강세 함정 구간입니다.
🟡 노랑 — 주기 단계 1
가격이 MM50 위로 교차했지만 이동평균선은 여전히 약세입니다. 회복의 첫 신호이며 아직 확정되지 않았습니다.
🔵 파랑 — 추세 반전 시도
MM100과 MM50이 MM200 아래에 있지만 가격이 그 사이를 오르기 시작했습니다. 높은 변동성 전환 구간 — 주의 깊게 관찰하세요.
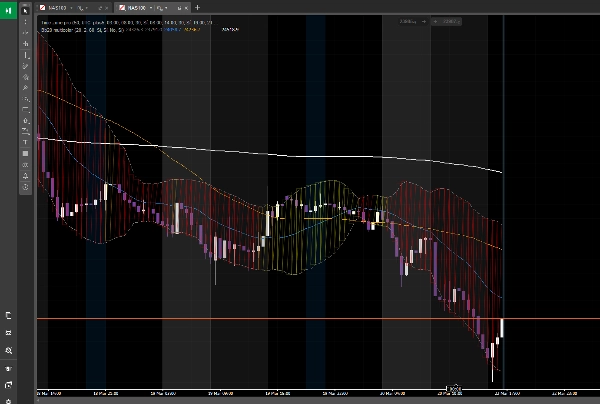
⬜ 회색 — 중립 / 약화
가격이 MM200 위에 있지만 MM100 아래에 있습니다. 장기 구조는 여전히 강세지만 모멘텀이 약해지고 있습니다. 주의 구간입니다.
🟢 라임 그린 — 주기 단계 2
가격과 MM50이 MM200 위에 있습니다. 새로운 강세 주기가 확인되고 있습니다. 많은 기관 투자자들이 이 구간에서 포지션을 잡기 시작합니다.
🪵 청록색 — 건강한 조정
가격이 MM200과 MM100 위에 있지만 MM50 또는 MM20 쪽으로 되돌림이 있습니다. 강세 추세 내 정상적인 일시 정지 — 재진입 가능 구간입니다.
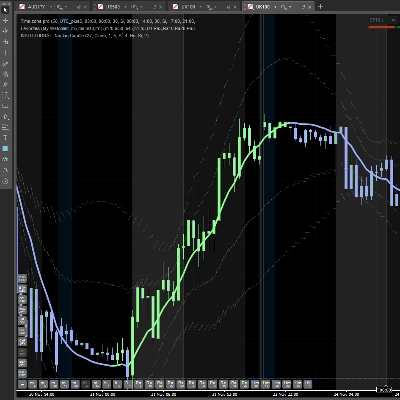
🌲 진한 녹색 — 성숙한 강세 주기
모든 이동평균선이 완벽하게 정렬됨: MM200 < MM50 < MM20 < 가격. 가장 깔끔한 추세 환경. 상승에 대한 최소 저항.
──────────────────────────
특징
──────────────────────────
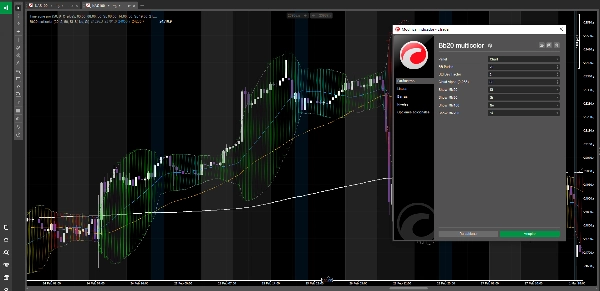
• cTrader의 Chart.DrawTriangle을 사용하여 클라우드 영역을 네이티브로 렌더링하여 부드럽고 전문적인 채우기 효과 제공
• 클라우드와 함께 볼린저 밴드(상단 및 하단) 표시
• 네 가지 이동평균선 모두 개별적으로 토글 가능 (MM20, MM50, MM100, MM200)
• 설정 가능한 BB 기간, 표준 편차 계수 및 클라우드 투명도
• 모든 종목과 모든 시간대에서 작동
• 완전한 오픈 소스 — 영원히 무료
──────────────────────────
사용 방법
──────────────────────────
1. 거래를 하기 전에 시장 상황 필터로 색상을 사용하세요
2. 배경이 녹색(라임 또는 진한 녹색)일 때만 롱을 찾으세요
3. 배경이 빨강 또는 주황일 때만 숏을 찾으세요
4. 노랑, 파랑, 회색은 전환 구간으로 사용 — 크기를 줄이거나 확인을 기다리세요
5. 청록색은 확립된 강세 추세에서 재진입 구간입니다
모든 거래 전략과 호환됩니다. 특히 가격 움직임, 거래량 분석 또는 심리 기반 접근법과 결합할 때 효과적입니다.
설치하고 차트에 적용하면 시장이 어떤 단계에 있는지 즉시 알 수 있습니다.
⚠️ 위험 고지
금융 상품 거래는 위험을 수반하며 모든 사람에게 적합하지 않습니다. 항상 스스로 분석하고, 위험을 신중히 관리하며, 감당할 수 없는 자금으로 거래하지 마십시오.
이 지표는 기술적 분석 도구이며 금융 조언이 아닙니다. 현명하게 사용하세요.
요약
- Red: Clear bearish trend (price below MM200)
- Orange: Technical bounce within bearish trend
- Yellow: Early recovery signs (price above MM50, but MAs bearish)
- Blue: Trend reversal attempt with high volatility
- Gray: Neutral or weakening momentum (price above MM200 but below MM100)
- Lime Green: Confirmed new bullish cycle (price and MM50 above MM200)
- Teal: Healthy consolidation in bullish trend (price above MM200 and MM100, pulling back)
- Dark Green: Mature bullish cycle with aligned moving averages
Features include native cloud rendering using cTrader's Chart.DrawTriangle, toggleable moving averages, configurable Bollinger Bands parameters, and compatibility with any instrument and timeframe. The indicator is open source and free to use. It serves as a market context filter to guide trade decisions, recommending long positions in green zones and shorts in red/orange zones, with caution advised in transition colors. It complements various trading strategies, including price action and volume analysis.


!["[Stellar Strategies] Market Session Ultimate" 로고](https://cdn.ctrader.com/image/webp/61ffd537-0125-4246-9e72-42eca1791d64_28232)


