
설명
VOLUME HEATMAP PRO - 전문 시장 밀도 시각화
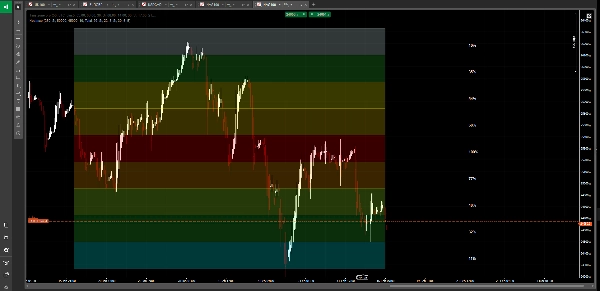
복잡한 거래량 데이터를 직관적인 시각적 표시로 변환하는 이 고급 볼륨 히트맵으로 이전과는 다른 시장을 경험하세요. 차트 하단에 막대만 표시하는 전통적인 거래량 지표와 달리, Volume Heatmap Pro는 기관 투자자들이 각 가격대에서 포지션을 축적하고 분배하는 정확한 위치를 보여줍니다.
주요 기능:
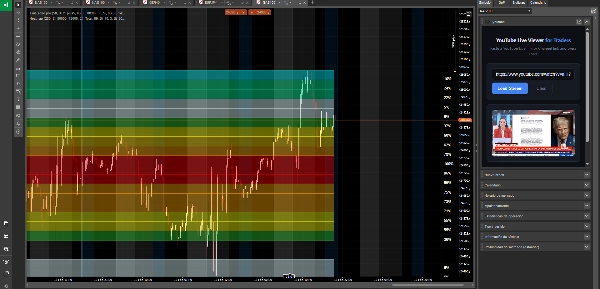
🔥 동적 색상 구분 히트맵
10단계 색상 그라데이션 시스템을 통해 거래량 분석을 경험하세요. 차가운 파란색(최소 활동)에서 불타는 빨간색(최대 거래량)까지, 큰 자금이 흐르는 위치를 즉시 식별할 수 있습니다. 히트맵은 실시간으로 업데이트되어 시장 밀도를 한눈에 보여줍니다.
📍 지배 가격대(POC) 감지
가장 높은 거래량을 가진 가격대를 자동으로 식별하고 강조 표시합니다 - 시장의 진정한 균형점입니다. 기관들이 가장 큰 포지션을 구축한 곳이며 가격이 되돌아오는 경향이 있는 지점입니다.
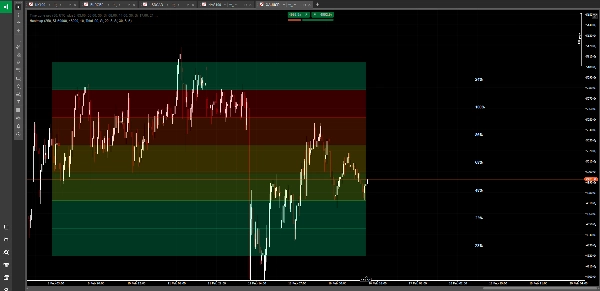
🎯 다중 레벨 거래량 분포
가격 범위를 최대 50개의 정밀한 레벨로 나누어 상세한 거래량 분포 지도를 만듭니다. 어떤 가격대가 활발한 거래를 유도했는지, 어떤 가격대가 시장에서 무시되었는지 정확히 확인할 수 있습니다.
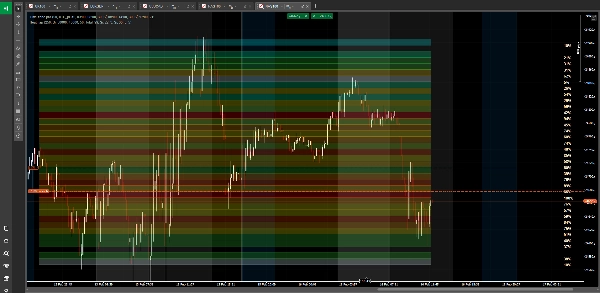
📊 세 가지 거래량 분석 모드
• 전체 거래량 - 모든 시장 활동 보기
• 매수 거래량만 - 강세 압력 구역 분리
• 매도 거래량만 - 약세 분배 영역 식별
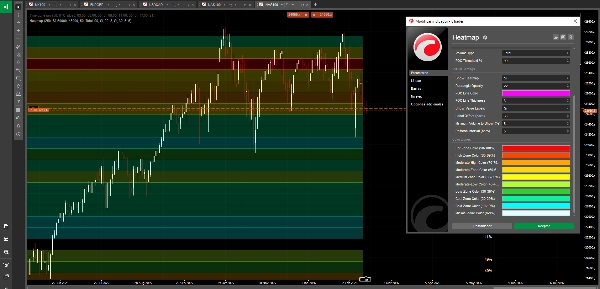
🎨 전문적 시각화
• 분석 기간을 아우르는 색상 구분 사각형
• 완벽한 차트 통합을 위한 조절 가능한 불투명도
• 각 레벨에 선택적 거래량 백분율 라벨
• 두께 조절 가능한 맞춤형 POC 선
• 깔끔하고 방해되지 않는 표시
⚙️ 스마트 자동 범위 기술
조회 기간에서 최적의 가격 범위를 자동으로 계산하거나 특정 분석을 위해 수동으로 범위를 정의할 수 있습니다. 히트맵은 모든 시장 상황이나 시간대에 적응합니다.
🔄 성능 최적화
구성 가능한 새로 고침 간격으로 부드러운 차트 성능을 보장하면서 정확한 거래량 분석을 유지합니다. 최대 500개의 바를 지연 없이 분석할 수 있습니다.
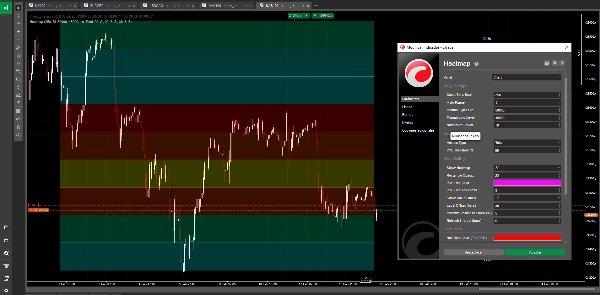
📈 맞춤형 색상 구역
시각적 선호도에 맞게 10가지 색상 구역을 모두 개인화하세요:
• 핫 존 (90-100%) - 최대 거래량 집중
• 하이 존 (80-89%) - 강한 활동
• 중상 (70-79%) - 평균 이상의 거래량
• 중간 (60-69%) - 견고한 활동
• 중간 (50-59%) - 평균 거래량
• 중하 (40-49%) - 평균 이하
• 로우 존 (30-39%) - 가벼운 활동
• 쿨 존 (20-29%) - 최소 거래
• 콜드 존 (10-19%) - 매우 적은 거래량
• 미니멀 (0-9%) - 거의 활동 없음
적합 대상:
• 기관 투자자의 축적 및 분배 구역 식별
• 잠재적 돌파구 영역을 위한 저거래량 노드 찾기
• 고거래량 지지 및 저항 수준 파악
• 시장 구조 및 유동성 이해
• 고거래량 구역에서 거래 진입 확인
• 저유동성 함정 구역 회피
• 다중 시간대 거래량 프로필 분석
차별점:
전통적인 거래량 지표는 얼마나 많이 거래되었는지 보여주지만 어디서 거래되었는지는 보여주지 않습니다. Volume Heatmap Pro는 완전한 그림을 보여줍니다 - 가장 많은 거래 활동이 집중된 가격대를 정확히 나타내는 시각적 밀도 지도입니다. 그라데이션 색상 시스템은 복잡한 거래량 분석을 날씨 지도를 읽는 것만큼 간단하게 만듭니다. 빨간색은 뜨거움(많은 거래량), 파란색은 차가움(적은 거래량)을 의미합니다.
당일 반전 스캘핑이든 스윙 트레이드를 위한 포지셔닝이든, 이 히트맵은 시장이 진정으로 확신하는 곳과 단순한 노이즈인 곳을 보여줍니다.
---
⚠️ 위험 고지:
외환, 암호화폐 및 기타 금융 상품 거래는 높은 위험을 수반하며 모든 투자자에게 적합하지 않을 수 있습니다. 높은 레버리지는 당신에게 불리하게 작용할 수도 있고 유리하게 작용할 수도 있습니다. 거래를 결정하기 전에 투자 목표, 경험 수준 및 위험 감수 성향을 신중히 고려해야 합니다. 투자금 전부 또는 일부를 손실할 가능성이 있습니다. 따라서 감당할 수 없는 돈을 투자해서는 안 됩니다. 거래와 관련된 모든 위험을 인지하고 의심이 있을 경우 독립적인 금융 상담가의 조언을 구해야 합니다. 과거 성과는 미래 결과를 보장하지 않습니다.
요약
Key features include automatic Point of Control (POC) detection, highlighting the price level with the highest trading volume, and multi-level volume distribution dividing the price range into up to 50 levels for detailed analysis. It supports three volume modes: total volume, buy volume only, and sell volume only, enabling users to isolate bullish or bearish pressure zones.
The indicator offers professional visualization with adjustable opacity, customizable color zones, optional volume percentage labels, and a customizable POC line. Smart auto-range technology calculates optimal price ranges based on the lookback period or manual input. Performance is optimized for smooth updates and analysis of up to 500 bars without lag.
Heatmap is suitable for identifying institutional accumulation and distribution zones, spotting support and resistance levels, understanding market structure, and conducting multi-timeframe volume profile analysis across markets including Forex, indices, and XAUUSD (gold).
고객 리뷰
5 | 67 % | |
4 | 33 % | |
3 | 0 % | |
2 | 0 % | |
1 | 0 % |


!["[Hamster-Coder] Moving Average MTF" 로고](https://cdn.ctrader.com/image/webp/b11b98b1-194d-4b8e-b00e-d611826ad159_31226)


