
Sniper Zone Pro
مؤشر
2 عمليات الشراء
الإصدار 1.0، Jan 2026
Windows, Mac
4.6
التقييمات: 3
مؤشر سنابر زون برو
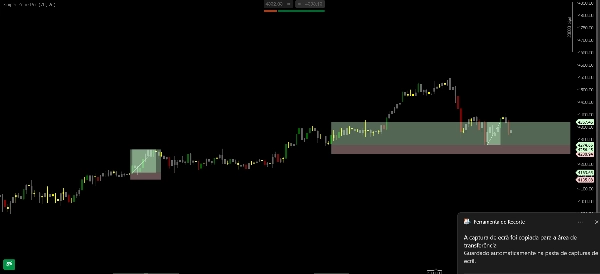
السنابر زون برو هو أداة تحليل متقدمة مصممة لتحديد بصري لبصمة المؤسسات الكبيرة على مخطط الأسعار. يجمع بين رسم خرائط مناطق عدم اليقين السابقة مع نظام تلوين الشموع الذي يكشف عن حركات التلاعب وقوة المؤسسات. يحول المؤشر فوضى السوق إلى مناطق تشغيل واضحة، مما يسمح للمتداولين بتحديد بالضبط أين "قاتل" السعر وأين يميل إلى الاختبار قبل التوسع الجديد.
الميزات الرئيسية لسنابر زون برو
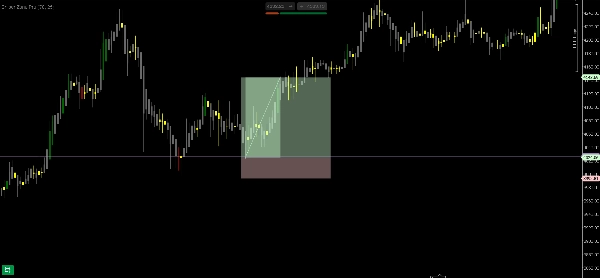
- رسم خرائط "مناطق المعركة": يحدد تلقائيًا مناطق عدم اليقين حيث تراكم الحجم السعري. تصبح هذه المناطق "مناطق تشغيل" حاسمة، حيث تمثل مستويات سعرية بها نزاعات كبيرة بين المشترين والبائعين.
- تلوين مؤسسي نشط: نظام الألوان ليس جماليًا فقط؛ بل يبرز الشموع التي تحمل خصائص حركة مؤسسية (مثل الحجم العالي أو الامتصاص)، مفصلًا ضوضاء السوق عن نوايا اللاعبين الرئيسيين.
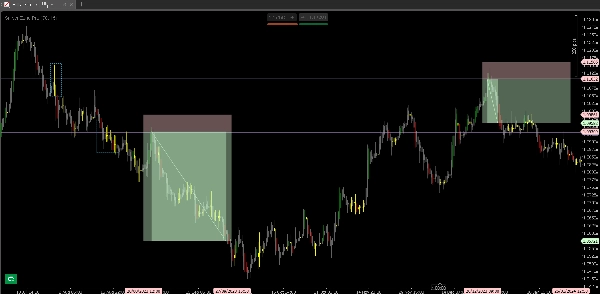
- مناطق اختبار عالية الاحتمالية: عند الوصول إلى منطقة رئيسية، يساعد المؤشر على تصور ما إذا كان السعر يختبر المنطقة فقط أو مستعد للاختراق، مقدمًا محفزات دخول أكثر دقة بكثير.
- مرشح التسلسل الهرمي (HTF): يعطي الأولوية لمناطق الاهتمام في أطر زمنية أعلى، حيث تكون معارك السعر ذات صلة فنية أكبر وإمكانية عودة أعلى بشكل ملحوظ.
لماذا تستخدم سنابر زون برو؟
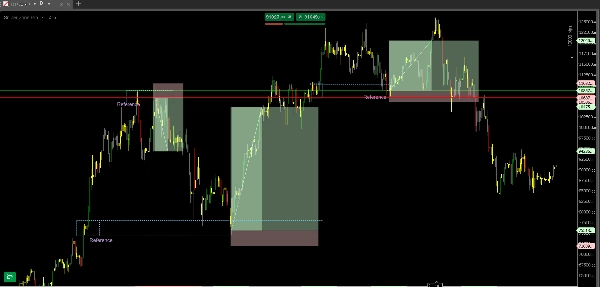
- قراءة نية السوق: من خلال مراقبة ألوان الشموع داخل مناطق المعركة، يمكن للمتداولين تحديد ما إذا كانت المؤسسات تدافع عن ذلك الموقع أو تتخلى عنه.
- تحديد مناطق التشغيل: يقضي على الشك في "أين تتداول". يظهر المؤشر أن أفضل الفرص ليست في منتصف حركة، بل في اختبارات المناطق التي أظهر فيها السعر عدم اليقين سابقًا.
- تقليل الذاتية: يتوقف المتداولون عن محاولة "تخمين" القمم والقيعان ويبدؤون في العمل بناءً على مناطق اهتمام محترفة مثبتة.
ملف تعريف المؤشر
4.6
التقييمات: 3
5 | 67 % | |
4 | 33 % | |
3 | 0 % | |
2 | 0 % | |
1 | 0 % |
تقييمات العملاء
January 19, 2026
The best part is random clicks become easier to catch, and a 1R exit plan makes review easier.
January 14, 2026
H1 makes the signal less noisy, and it adds a useful layer without forcing action.
January 5, 2026
No reason to yolo this live without a few normal sessions. The result needs a journal.
BTCUSD
Forex
Signal
Breakout
Indices
EURUSD
Commodities
GBPUSD
NZDUSD
Scalping
Crypto
Stocks
XAUUSD
NAS100
USDJPY
يتم توفير المنتجات المتاحة من خلال cTrader Store، بما في ذلك روبوتات التداول والمؤشرات والإضافات، من قبل مطوري الطرف الثالث وإتاحتها لأغراض الوصول المعلوماتي والفني فقط. cTrader Store ليس وسيطًا ولا يقدم نصائح استثمارية أو توصيات شخصية أو أي ضمان للأداء المستقبلي.

![شعار "[Hamster-Coder] Moving Average MTF"](https://cdn.ctrader.com/image/webp/b11b98b1-194d-4b8e-b00e-d611826ad159_31226)


منذ 11/07/2025
2
المبيعات