
Candles_Painter
Indikator
3 pembelian
Versi 1.0, Aug 2025
Windows, Mac
5.0
Ulasan: 2
Sejak 26/05/2025
406.45M
Volume trading
60.92K
Pip dimenangkan
15
Penjualan
1.42K
Instal gratis
Deskripsi
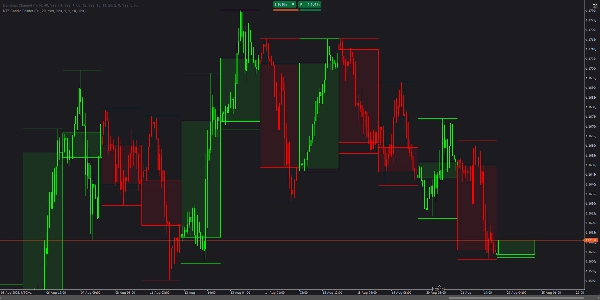
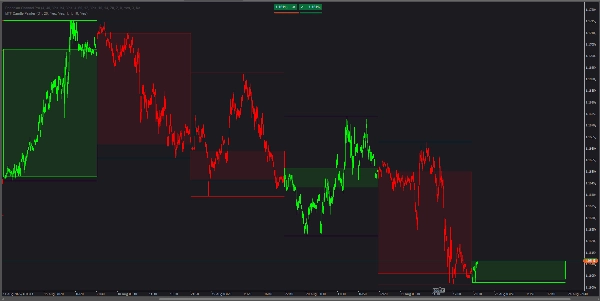
MTF Candle Painter menimpa kerangka waktu lebih tinggi (HTF) langsung pada grafik Anda saat ini. Ini mewarnai setiap batang pada kerangka waktu aktif berdasarkan arah lilin HTF yang mengelilinginya dan menggambar persegi panjang badan HTF yang terisi (hanya buka–tutup, tanpa sumbu) plus garis HTF High/Low opsional. Warna bull/bear terpisah dan opasitas isi yang dapat disesuaikan memberikan bias yang bersih dan mudah dibaca sekilas.
Fitur Utama
- Pewarnaan batang multi-kerangka waktu: semua batang di dalam lilin HTF mewarisi warna bullish/bearish-nya.
- Overlay badan HTF: persegi panjang antara buka dan tutup HTF; tanpa sumbu tengah untuk kejelasan.
- Gaya bull/bear terpisah: warna garis tepi dan isi yang independen untuk lilin HTF bullish dan bearish.
- Opasitas yang dapat disesuaikan: atur transparansi isi (default 10%) untuk penumpukan yang rapi dengan harga.
- Garis HTF High/Low: opsional, dengan ketebalan yang dapat dikonfigurasi.
- Kontrol lookback: pilih berapa banyak lilin HTF terbaru yang akan digambar (default 20).
- Ringan: menggunakan objek grafik asli; cepat dan tidak mengganggu.
Parameter
Inti
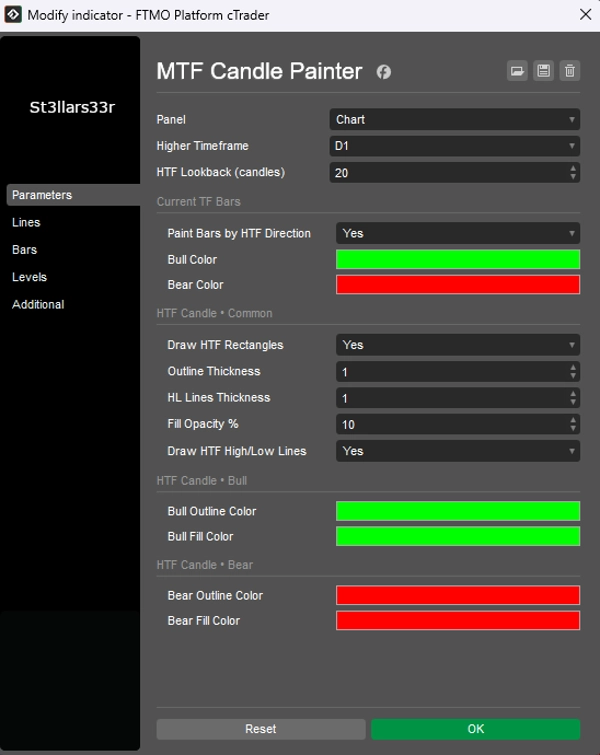
Kerangka Waktu Lebih Tinggi– HTF untuk overlay (misalnya, D1, H4, W1).HTF Lookback (lilin)– berapa banyak lilin HTF yang akan digambar (default 20).
Batang TF Saat Ini
Warnai Batang berdasarkan Arah HTF– warnai batang TF saat ini berdasarkan lilin HTF yang mengelilinginya (Ya/Tidak).Warna Bull/Warna Bear– warna untuk batang TF saat ini.
Lilin HTF • Umum
Gambar Persegi Panjang HTF– tampilkan persegi panjang badan HTF (default Ya).Ketebalan Garis Tepi– ketebalan garis tepi badan HTF.Ketebalan Garis HL– ketebalan garis HTF High/Low.Persentase Opasitas Isi– transparansi isi badan HTF (default 10%).Gambar Garis HTF High/Low– aktifkan garis HTF High/Low (Ya/Tidak).
Lilin HTF • Bull
Warna Garis Tepi Bull– warna garis tepi untuk lilin HTF bullish.Warna Isi Bull– warna isi untuk lilin HTF bullish.
Lilin HTF • Bear
Warna Garis Tepi Bear– warna garis tepi untuk lilin HTF bearish.Warna Isi Bear– warna isi untuk lilin HTF bearish.
Untuk Siapa
- Trader intraday dan scalper yang membutuhkan bias HTF terus-menerus tanpa harus mengganti grafik.
- Praktisi SMC/Wyckoff yang mengandalkan struktur kerangka waktu lebih tinggi saat mengeksekusi pada TF lebih rendah.
- Siapa saja yang menginginkan konteks HTF visual yang bersih yang dilapisi pada kerangka waktu kerja mereka.
Ringkasan
Ringkasan AI
Candles_Painter is a multi-timeframe indicator designed to overlay higher timeframe (HTF) candle context onto a lower timeframe chart. It visually colors each bar on the active timeframe according to the bullish or bearish direction of the enclosing HTF candle. The indicator draws filled rectangles representing the HTF candle bodies (open to close, excluding wicks) with customizable fill opacity and separate colors for bullish and bearish candles. Optional HTF high and low lines can also be displayed with adjustable thickness.
Key features include:
- Coloring of all bars within an HTF candle by its direction.
- HTF body overlays for clear visual bias.
- Independent styling for bullish and bearish HTF candles.
- Adjustable transparency for neat integration with price data.
- Configurable lookback period for the number of HTF candles shown.
- Lightweight implementation using native chart objects for performance.
Users can customize parameters such as the higher timeframe to overlay (e.g., daily, 4-hour), colors for bars and HTF candles, opacity, and whether to display HTF high/low lines. This tool is suited for intraday traders, scalpers, and market structure practitioners who require continuous HTF context without switching charts.
Profil indikator
Ulasan pelanggan
5.0
Ulasan: 2
5 | 100 % | |
4 | 0 % | |
3 | 0 % | |
2 | 0 % | |
1 | 0 % |
Ulasan pelanggan
September 1, 2025
The log becomes easier to read, but a manual check is still part of the process.
August 27, 2025
A few ugly trades are useful in the sample, and it makes the setup easier to question.
Diskusi
Pertanyaan umum
Produk-produk yang tersedia melalui cTrader Store, termasuk bot trading, indikator, dan plugin, disediakan oleh pengembang pihak ketiga serta hanya ditujukan untuk akses teknis dan informasi. cTrader Store bukan broker dan tidak menyediakan saran investasi, rekomendasi pribadi, atau jaminan apa pun tentang kinerja di masa mendatang.


Harga
Sejak 26/05/2025
406.45M
Volume trading
60.92K
Pip dimenangkan
15
Penjualan
1.42K
Instal gratis