
Deskripsi
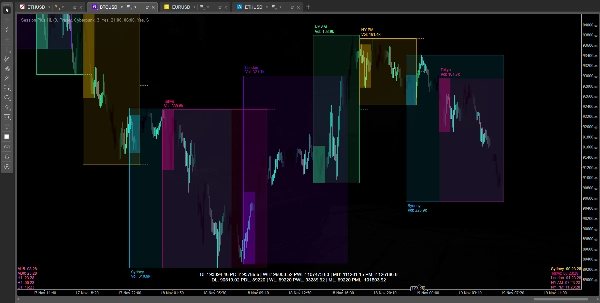
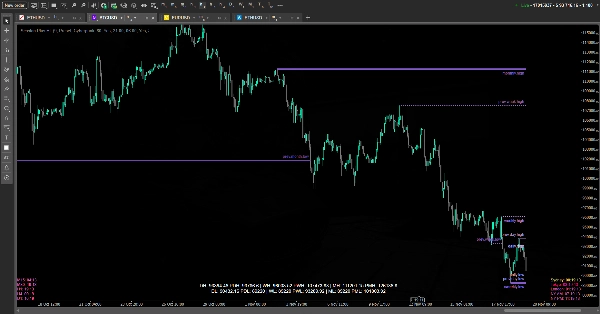
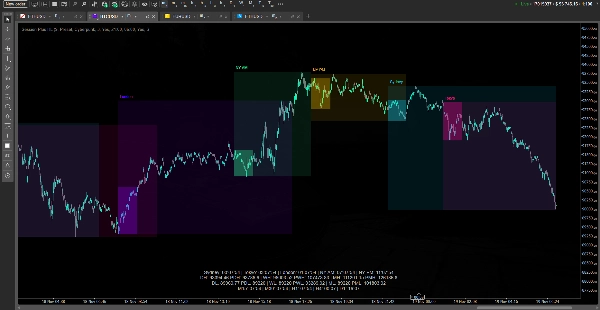
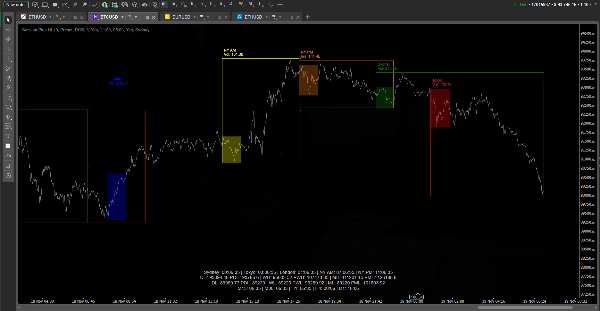
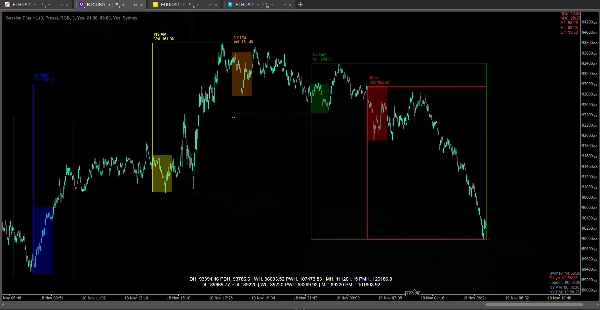
Indikator ini dirancang untuk memvisualisasikan struktur pasar dan konteks berbasis waktu bagi para trader intraday. Ini secara otomatis menggambar sesi perdagangan utama (Sydney, Tokyo, London, New York AM/PM) sebagai kotak di grafik, menunjukkan level tertinggi/terendah dan level tengah opsional, serta dapat menyoroti rentang Initial Balance (IB) di dalam setiap sesi. Ini juga menggambar level referensi kunci dari timeframe yang lebih tinggi — tertinggi dan terendah hari/minggu/bulan saat ini dan sebelumnya — dan menampilkannya baik sebagai garis di grafik maupun sebagai dashboard ringkas, sehingga Anda selalu melihat posisi harga relatif terhadap kumpulan likuiditas terbaru.
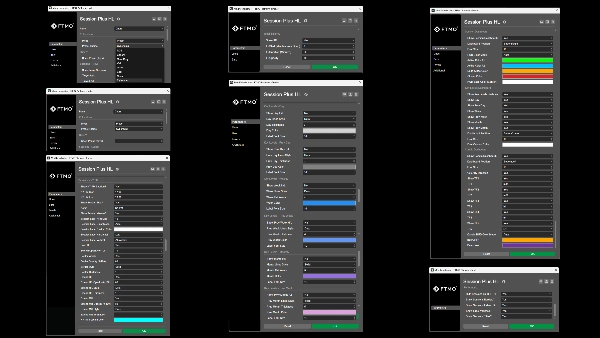
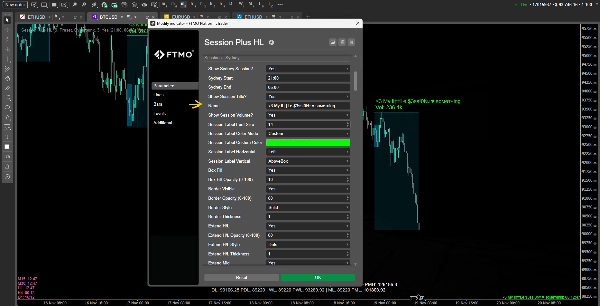
Selain itu, indikator ini menyediakan beberapa HUD: dashboard sesi yang menunjukkan berapa lama waktu tersisa hingga setiap sesi dibuka atau ditutup, dashboard level kunci yang merangkum semua nilai H/L harian/mingguan/bulanan, dan dashboard candle yang menunjukkan waktu tersisa pada candle di beberapa timeframe yang lebih tinggi serta status bullish/bearish mereka. Semua visual dapat disesuaikan tema (preset warna atau warna kustom), dapat diatur untuk kinerja (menyembunyikan sesi pada TF yang lebih tinggi, mengontrol garis pendek sebagai pengganti ekstensi dinamis berat), dan dimaksudkan untuk mendukung analisis sapuan likuiditas, rentang sesi, dan waktu tanpa memenuhi atau memperlambat grafik.
Ringkasan
Ulasan pelanggan
5 | 0 % | |
4 | 50 % | |
3 | 50 % | |
2 | 0 % | |
1 | 0 % |


