
Moving Average Plus
Indikator
144 unduhan
Versi 1.0, Aug 2025
Windows, Mac
Deskripsi
Global
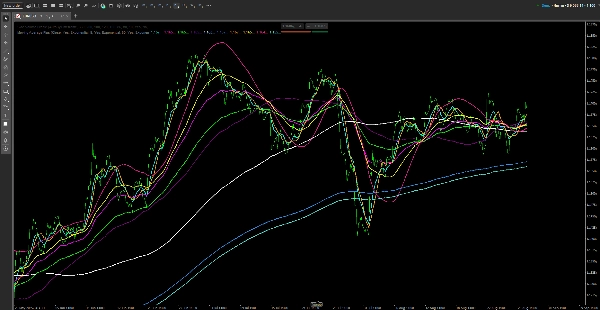
- Source – input harga yang digunakan oleh semua garis: Close, Open, High, Low, Median, Typical, atau Weighted Close.
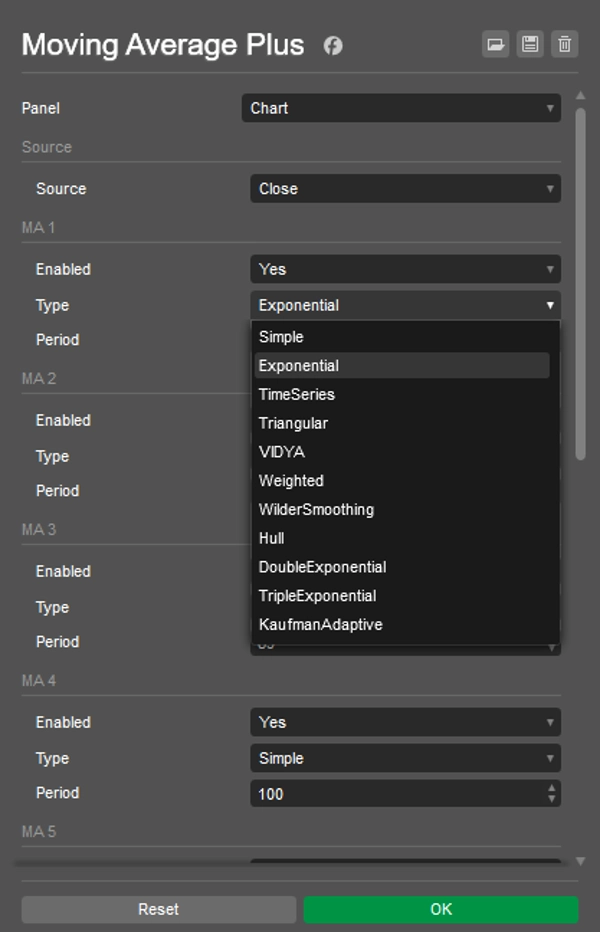
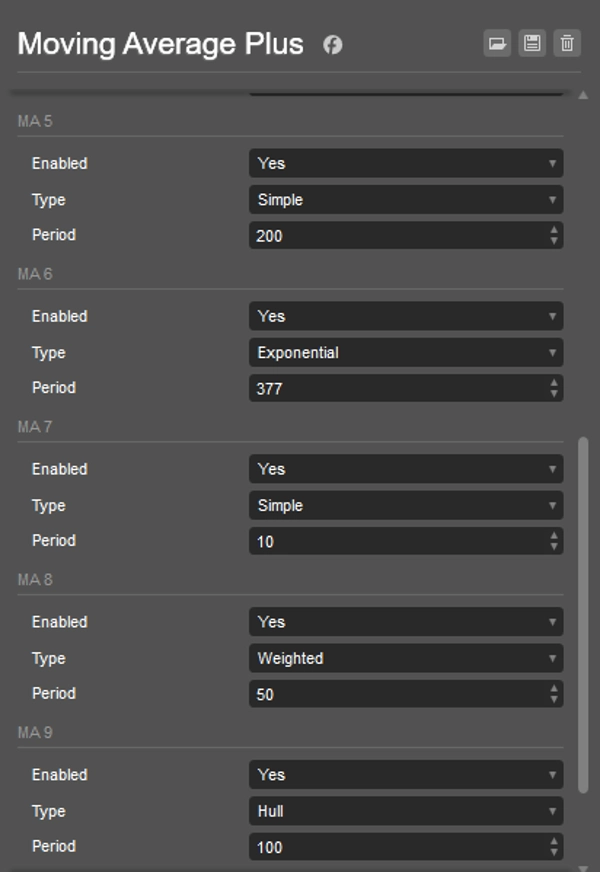
Per line (MA 1 … MA 10)
- Enabled – nyalakan/matikan garis (garis yang dimatikan tidak dihitung).
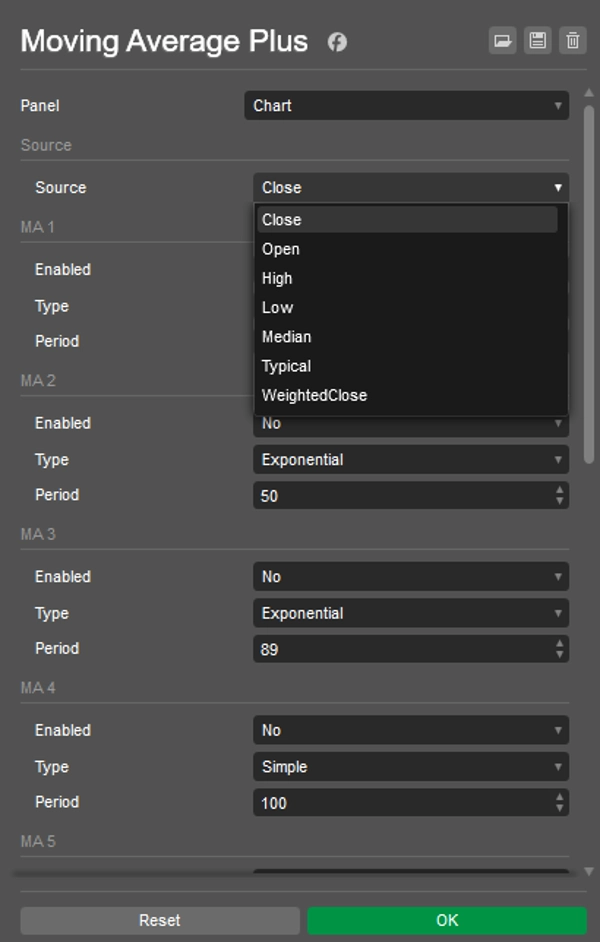
- Type – pilih salah satu dari
MovingAverageTypecTrader (misalnya, Simple, Exponential, Weighted, Wilder Smoothing, Hull, Triangular, Time Series, dll.).
Catatan: beberapa tipe tergantung pada versi cTrader Anda; jika tipe tidak tersedia (misalnya, Hull), pilih yang lain. - Period – panjang MA (≥1).
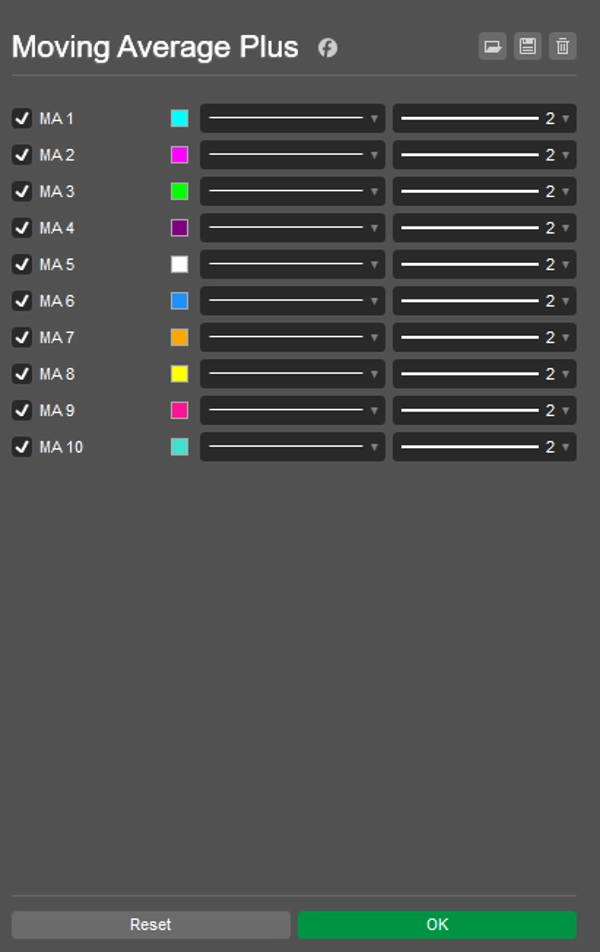
Colors & thickness
- Atur di tab Colors dari parameter indikator untuk setiap output (“MA 1” … “MA 10”).
Tips
- Untuk kinerja, matikan garis yang tidak digunakan.
- Jika Anda mengubah Source atau Type/Period, indikator akan menghitung ulang secara otomatis.
- Wilder di cTrader dinamai Wilder Smoothing (
MovingAverageType.WilderSmoothing).
Ringkasan
Ringkasan AI
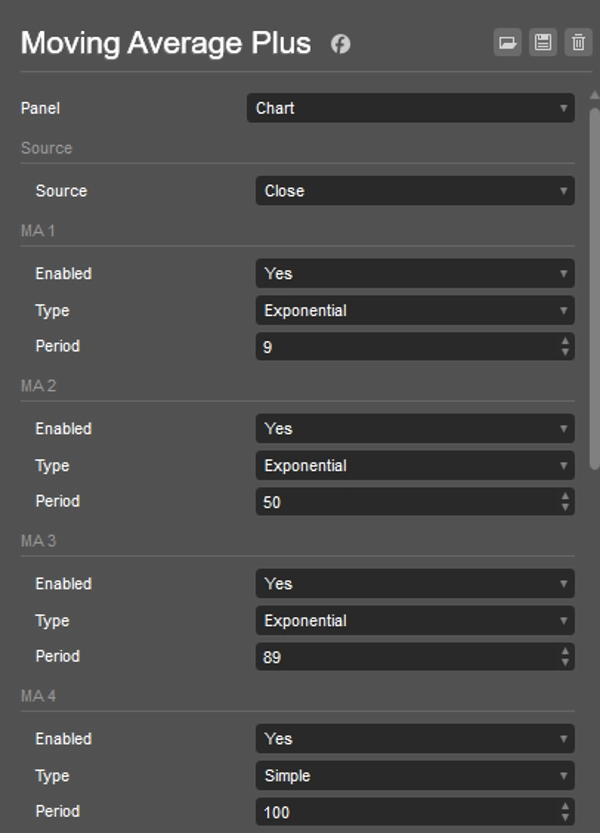
Moving Average Plus is a technical indicator for trading platforms that provides up to 10 configurable moving average lines. Each line can be individually enabled or disabled to optimize performance. Users select a single price source—such as Close, Open, High, Low, Median, Typical, or Weighted Close—that applies to all moving averages. For each line, the type of moving average can be chosen from various options including Simple, Exponential, Weighted, Wilder Smoothing, Hull, Triangular, and Time Series, depending on platform support. The period (length) of each moving average is adjustable with a minimum of 1. Colors and line thickness for each moving average are customizable through the indicator’s color settings. The indicator automatically recalculates when changes are made to the price source, type, or period. This tool is designed to assist traders in analyzing price trends by overlaying multiple moving averages with flexible configurations on their charts.
Profil indikator
Ulasan pelanggan
0.0
Ulasan: 0
Ulasan pelanggan
Belum ada ulasan untuk produk ini. Sudah mencobanya? Jadilah pemberi ulasan pertama!
Diskusi
Pertanyaan umum
Produk-produk yang tersedia melalui cTrader Store, termasuk bot trading, indikator, dan plugin, disediakan oleh pengembang pihak ketiga serta hanya ditujukan untuk akses teknis dan informasi. cTrader Store bukan broker dan tidak menyediakan saran investasi, rekomendasi pribadi, atau jaminan apa pun tentang kinerja di masa mendatang.


Harga
Sejak 26/05/2025
449.3M
Volume trading
61.1K
Pip dimenangkan
15
Penjualan
1.43K
Instal gratis