
Deskripsi
CandleColourFlow adalah indikator inovatif yang dirancang untuk dengan jelas dan cepat mengidentifikasi tren dan titik balik pasar di pasar Forex. Dengan sistem warna yang sederhana dan intuitif, bahkan trader pemula dapat membuat keputusan trading yang lebih tepat.
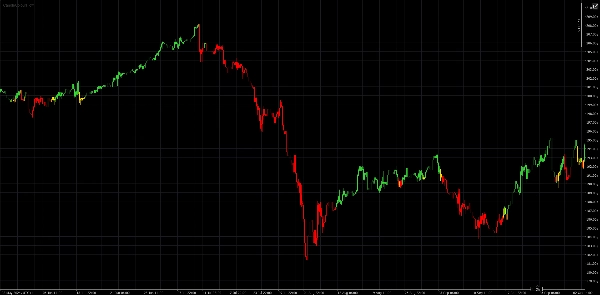
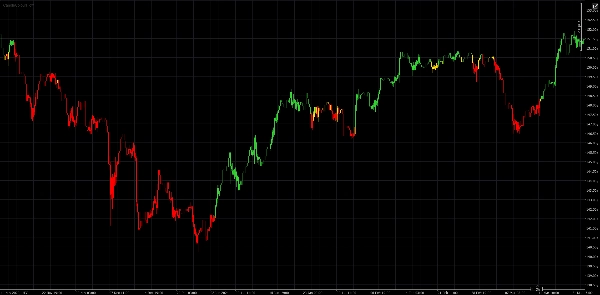
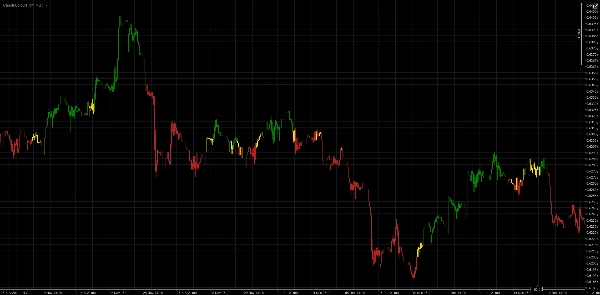
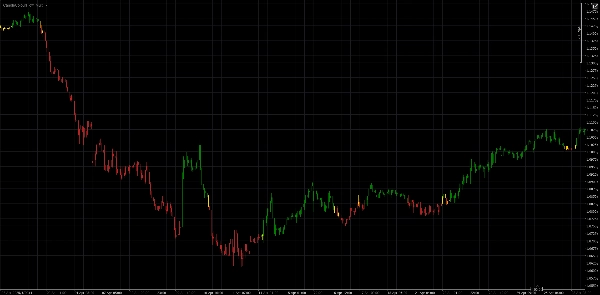
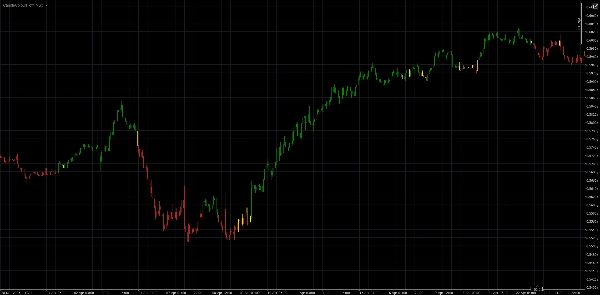
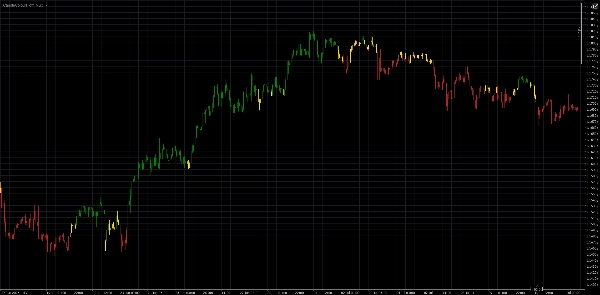
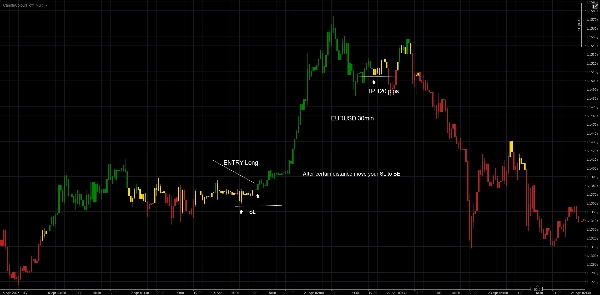
🔹 Lilin hijau – menunjukkan kondisi yang menguntungkan untuk membuka posisi long
🔹 Lilin merah – menunjukkan peluang trading short yang potensial
🔹 Lilin emas – menandakan ketidakpastian pasar: potensi konsolidasi atau kelanjutan tren
💡 Apa yang membuat CandleColourFlow unik?
- Wawasan visual yang jelas tentang kondisi pasar tanpa perlu banyak indikator
- Deteksi otomatis pergeseran momentum dan perubahan struktur harga
- Sangat cocok untuk menilai keadaan pasar secara cepat
- Bekerja pada semua kerangka waktu namun menurut saya 1 jam ke atas adalah yang terbaik, tapi semua tergantung preferensi
⚠️ Penafian Hukum:
Indikator ini dimaksudkan hanya untuk tujuan edukasi. Ini bukan merupakan nasihat investasi atau rekomendasi untuk melakukan transaksi keuangan apapun.
Mencari lebih banyak?
Versi tambahan dari CandleColourFlow akan segera hadir – masing-masing dengan fitur unik dan dukungan pasar yang lebih luas.
Ringkasan
Ulasan pelanggan
5 | 0 % | |
4 | 100 % | |
3 | 0 % | |
2 | 0 % | |
1 | 0 % |


![Logo "[Hamster-Coder] Bollinger Bands"](https://cdn.ctrader.com/image/webp/21d8e5d6-fb11-4bac-b9ee-cd05c2b76804_30327)

![Logo "[Stellar Strategies] Inside Bar with Signals"](https://cdn.ctrader.com/image/webp/1d9e8bfa-3b2c-4440-bb37-5856902008a7_30683)


