
Deskripsi
Peramalan Harga Berbasis MACD
Ikhtisar
Indikator ini menembus batasan MACD tradisional dengan bergerak melampaui analisis historis, secara inovatif memperkenalkan memori historis dan algoritma statistik untuk meramalkan aksi harga di masa depan.
Mekanisme Inti:
- Memori Tren Historis: Indikator mencatat perpindahan harga dari tren MACD masa lalu (baik bullish maupun bearish) relatif terhadap titik awalnya, membangun basis data statistik hingga 50 tren terbaru.
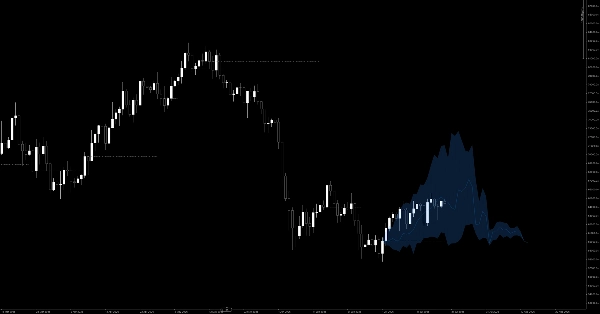
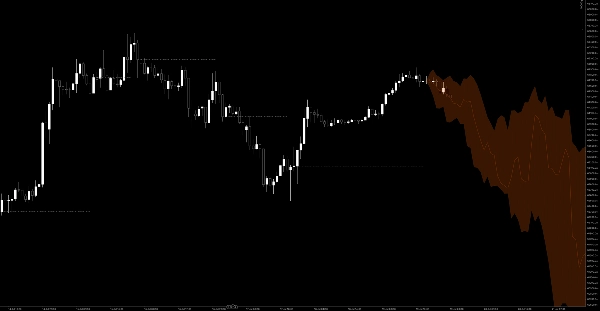
- Kipas Peramalan Probabilitas: Ketika terjadi crossover MACD baru (baik melewati garis nol atau garis sinyal), indikator mengambil data dari memori historis. Ia menghitung persentil 20%, 50%, dan 80% dari perubahan harga dan memproyeksikan kipas peramalan probabilitas untuk 100 bar berikutnya di sisi kanan grafik.
- Awan Area Sinyal Dinamis: Ini menandai "Harga Referensi" tempat asal pembalikan tren. Ketika harga waktu nyata berada di atas harga referensi ini dalam tren naik, ia melukis area awan hijau; sebaliknya, melukis awan merah dalam tren turun. Ini memberikan konfirmasi visual langsung dari momentum bullish atau bearish yang sebenarnya.
(Catatan: Indikator ini menampilkan rendering grafis yang sangat dioptimalkan, menggunakan perpaduan poligon tanpa batas untuk zona visual yang jelas dan garis referensi diskontinu yang halus untuk pengalaman grafik yang sangat bersih.)
Aturan Perdagangan & Panduan Pengguna
Indikator ini melampaui sinyal "beli/jual pada crossover" sederhana—ia memberikan Anda peta jalan probabilistik untuk perdagangan Anda.
1. Menemukan Entri (Konfirmasi Tren)
- Entri Long: Ketika terjadi crossover MACD bullish, sebuah kipas peramalan biru yang memproyeksikan ke atas akan muncul di kanan. Jangan terburu-buru masuk. Tunggu untuk melihat apakah harga stabil di atas garis titik-titik (Harga Referensi) dan awan bullish hijau mulai mengembang. Ini mengonfirmasi bahwa momentum saat ini sesuai dengan statistik historis bullish, memberikan peluang kuat untuk membeli saat harga turun.
- Entri Short: Ketika terjadi crossover MACD bearish, sebuah kipas peramalan oranye yang memproyeksikan ke bawah akan muncul. Cari harga yang tetap di bawah garis referensi dengan awan bearish merah yang mengembang untuk mengonfirmasi entri short pada pullback.
2. Menetapkan Target Take Profit
Kipas peramalan berfungsi sebagai panduan take-profit dinamis yang sangat baik:
- Target 1 (Garis Tengah): Garis tengah di dalam kipas mewakili persentil historis 50% (trajektori rata-rata). Ketika harga menyentuh garis ini, artinya pergerakan saat ini telah mencapai rata-rata historis, menjadikannya tempat ideal untuk mengambil keuntungan sebagian.
- Target 2 (Tepi Luar Kipas): Batas atas (persentil 80%) atau batas bawah (persentil 20%) mewakili ekstrem historis. Jika harga mencapai tepi ini, momentum sangat habis, dan pembalikan atau pullback dalam sangat mungkin terjadi. Pertimbangkan untuk menutup seluruh posisi.
3. Penempatan Stop Loss Ilmiah
- Garis putus-putus abu-abu (Harga Referensi) berfungsi sebagai garis dasar untuk setiap tren.
- Saat masuk long, tempatkan stop loss sedikit di bawah garis abu-abu ini. Jika harga menembus harga referensi dan awan hijau menghilang, itu berarti aksi harga sebenarnya telah membatalkan probabilitas bullish historis. Setup tren gagal, dan Anda harus segera memotong kerugian.
4. Filter Pasar Ranging
- Jika terjadi crossover MACD tetapi kipas peramalan yang diproyeksikan tampak sangat datar atau menyempit, itu berarti secara historis, crossover serupa hanya menghasilkan aksi sideways yang berombak.
- Saat Anda melihat kipas datar, tahan diri dan hindari berdagang. Tunggu siklus berikutnya di mana kipas menunjukkan ekspansi naik atau turun yang jelas.
Ringkasan
Key features include a probability forecasting fan that projects 20%, 50%, and 80% price change percentiles for the next 100 bars following a MACD crossover. The indicator visually displays this fan on the chart, with blue fans for bullish signals and orange for bearish. A dynamic signal area cloud highlights momentum: green for confirmed uptrends above a reference price and red for downtrends below it.
Trading guidance involves waiting for price confirmation above or below the reference price and cloud before entering long or short positions. The forecasting fan also serves as a dynamic take-profit guide, with the middle line representing average historical moves and outer edges indicating potential trend exhaustion. Stop-loss placement is recommended just beyond the reference price line to manage risk.
Additionally, the indicator filters ranging markets by identifying flat or contracted fans, signaling sideways price action and advising traders to avoid entering trades during such periods. The indicator supports visualization outputs and is tagged under MACD and momentum indicators.