
Mô tả
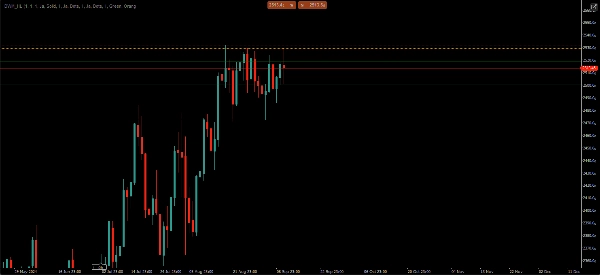
Mức Thanh Khoản NGS – Cao & Thấp Hàng Ngày • Hàng Tuần • Hàng Tháng
Giao dịch quanh thanh khoản, không phải quanh các đường ngẫu nhiên.
Mức Thanh Khoản NGS tự động hiển thị các mức thanh khoản quan trọng nhất hàng Ngày, Tuần và Tháng trên mọi biểu đồ.
• Không cần vẽ thủ công
• Không cần chuyển đổi khung thời gian
• Không làm rối biểu đồ
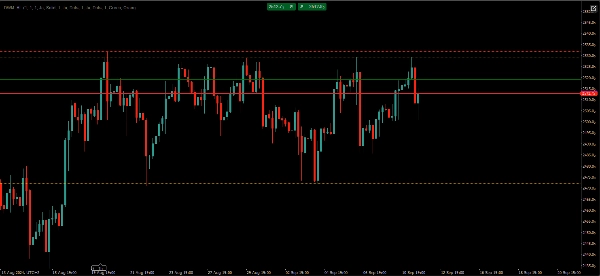
Chỉ báo thân thiện với người dùng này giúp các nhà giao dịch xác định các mức thanh khoản và cấu trúc thị trường chính trong vài giây. Thay vì đánh dấu thủ công các mức cao và thấp mỗi ngày, các mức quan trọng nhất được tự động hiển thị và cập nhật cho bạn.
Tính năng:
• Mức Cao & Thấp hàng Ngày tự động
• Mức Cao & Thấp hàng Tuần tự động
• Mức Cao & Thấp hàng Tháng tự động
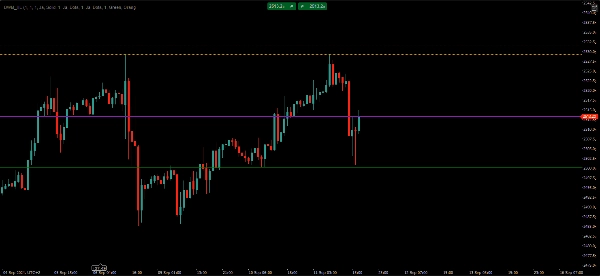
• Tùy chọn các mức của kỳ trước
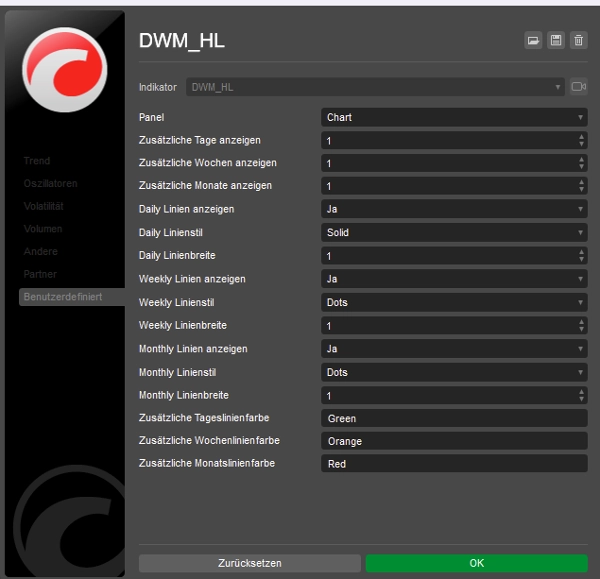
• Màu sắc và kiểu đường có thể tùy chỉnh
• Hiển thị biểu đồ sạch sẽ và nhẹ nhàng
• Hoạt động trên Forex, Chỉ số, Hàng hóa và Tiền điện tử
• Hỗ trợ nhiều khung thời gian
• Không vẽ lại
Được thiết kế cho các nhà giao dịch tập trung vào cấu trúc thị trường, thanh khoản và các mức khung thời gian cao hơn.
Không có tín hiệu.
Không có chiến lược.
Không hứa hẹn lợi nhuận.
Chỉ các mức thanh khoản khách quan và quy trình giao dịch sạch hơn.
Tóm tắt
Đánh giá của khách hàng
5 | 100 % | |
4 | 0 % | |
3 | 0 % | |
2 | 0 % | |
1 | 0 % |


