
Footprint Chart_noSourceCode
Chỉ báo
1 lượt mua
Phiên bản 1.0, Sep 2025
Windows, Mac
4.3
Đánh giá: 3
Mô tả
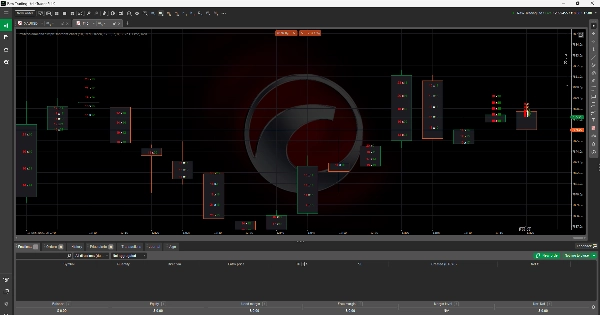
Chỉ báo Biểu đồ Dấu chân
Chỉ báo Biểu đồ Dấu chân cung cấp cho các nhà giao dịch cái nhìn chi tiết về luồng lệnh bằng cách hiển thị khối lượng đặt mua và đặt bán trực tiếp bên trong mỗi cây nến giá. Khác với biểu đồ nến truyền thống, công cụ này cho phép người dùng thấy được áp lực mua và bán tập trung ở các mức giá cụ thể. Bằng cách làm nổi bật sự mất cân bằng giữa người mua và người bán, nó cung cấp những hiểu biết sâu sắc hơn về độ sâu thị trường, tính thanh khoản và hoạt động giao dịch. Điều này làm cho nó trở thành một công cụ thiết yếu cho các nhà giao dịch muốn tinh chỉnh điểm vào, điểm ra và quản lý rủi ro thông qua phân tích luồng lệnh nâng cao.
Tóm tắt
Tóm tắt AI
The Footprint Chart Indicator enhances traditional candlestick charts by displaying bid and ask volumes within each price candle. This visualization allows traders to observe buying and selling pressure at specific price levels, revealing imbalances between buyers and sellers. By providing detailed insights into order flow, market depth, liquidity, and trading activity, the indicator supports more precise trade entries, exits, and risk management decisions. It is applicable across various markets including Forex, cryptocurrencies (e.g., BTCUSD), commodities, indices, and stocks. The tool is designed for traders who utilize advanced order flow analysis to refine their strategies.
Hồ sơ chỉ báo
Đánh giá của khách hàng
4.3
Đánh giá: 3
5 | 67 % | |
4 | 0 % | |
3 | 33 % | |
2 | 0 % | |
1 | 0 % |
Đánh giá của khách hàng
September 29, 2025
This fits volume based context better as a review layer. The first forward check can be 97 setups on M1, with 20 reactions and manual notes.
September 26, 2025
More useful for someone who wants less noise in the process. The best use is checking participation and pressure, then leaving the final filter manual.
September 23, 2025
I liked it more as a confirmation layer for volume based context than as something to follow blindly. Pressure is easier to read, and the final decision still feels like it belongs to the trader. Light sizing makes the early sample easier to judge.
Thảo luận
Câu hỏi thường gặp
BTCUSD
Forex
Signal
Indices
EURUSD
Commodities
GBPUSD
NZDUSD
Prop
Scalping
Crypto
Stocks
XAUUSD
NAS100
USDJPY
Các sản phẩm có sẵn trên cTrader Store, bao gồm bot giao dịch, chỉ báo và plugin, được cung cấp bởi các nhà phát triển bên thứ ba và chỉ nhằm mục đích cung cấp thông tin và tiếp cận kỹ thuật. cTrader Store không phải là nhà môi giới và không cung cấp lời khuyên đầu tư, khuyến nghị cá nhân hay bất kỳ đảm bảo nào về hiệu suất trong tương lai.
Sản phẩm khác của tác giả này


Giá
Kể từ 15/01/2025
7
Lượt bán