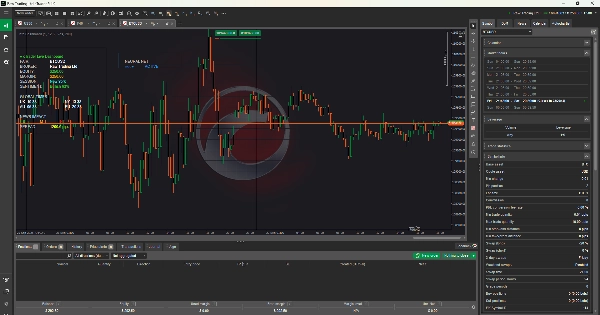
"Info Dashboard_noSourceCode" 标识
Info Dashboard_noSourceCode
"Info Dashboard_noSourceCode" 已上传图片
注册日期 15/01/2025
6
销售

Read the market smarter with AI.
The Info Dashboard is your all-in-one trading companion, combining neural networks, sentiment analysis, and live market data into a single powerful tool.

AI Neural Net Insights – Instantly detect patterns and predict market moves.
News & Sentiment Impact – Stay ahead of market-shaking events.
Equity & Balance Tracking – Monitor your account health in real time.
Global Market Clocks – Never miss a session open or close.
Pair Strength & Spread Monitor – Identify the strongest opportunities.

Designed for forex, crypto, and indices, the dashboard gives you clarity and speed, turning complex data into actionable signals. Perfect for both new and professional traders who want an edge over the market.

With the Info Dashboard, you don’t just follow the charts—you understand them.
Upgrade your trading today and experience the future of market analysis.

Indicator profile
0.0
评价:0
客户评价
该产品尚无评价。已经试过了?抢先告诉其他人!
Signal
Indices
Commodities
GBPUSD
MACD
Bollinger
Scalping
Supertrend
AI
XAUUSD
NAS100
BTCUSD
Forex
Breakout
RSI
EURUSD
NZDUSD
Fibonacci
Martingale
VWAP
Prop
ZigZag
ATR
SMC
Crypto
Grid
Stocks
Fair Value Gap (FVG)
USDJPY
Products available through cTrader Store, including trading bots, indicators and plugins, are provided by third-party developers and made available for informational and technical access purposes only. cTrader Store is not a broker and does not provide investment advice, personal recommendations or any guarantee of future performance.

该作者的其他作品

"Footprint Chart: Visualize bid-ask volume inside candles for clearer order flow and market depth insights."
Footprint volume indicator showing bid/ask splits at each price level
VWAP with standard deviation bands. Fully customizable colors, periods, and multipliers for precise trading signals
Pro trading dashboard: WVAP analysis + Volume Profile + Neural AI tracking + News alerts. All-in-one tool!
Session Volume Profile
Market Profile maps price vs. time to reveal where value is accepted (VAH/VAL) and rejected (POC), helping traders fade
"Advanced forex bot combining RSI, London Breakout & Swing strategies with pro risk management & live performance
Trading system combining Elliott Wave analysis with Bollinger Bands and multiple safety features
RSI Grid System with 200 EMA filter combining momentum, grid distance, and trend alignment for precision entries.

猜您喜欢

Weis & Wyckoff System v2.0
1 Candel High Time Freme
DXY Valuation Zones
Overbought Oversold Indicator
LIQUIDITY POOLS,ACCURATE SIGNAL, NO DELAY,80% PROBABILITY
ZigZag Pro DEMO – Multi-Swing Indicator for cTrader DEMO VERSION – 24 hours free trial! This is a DEMO version of the Z
"Renko Wicks" 标识
4.7
(4)
免费
Renko Wicks
"PMAX" 标识
5.0
(6)
免费
It's a combination of two trailing stop loss and the other one is well-known ATR-based SuperTrend.
you could put your check list in your chart you could split your test with “,” you could put your checklist in indicat
Scalping & Swing signals in one. Smart S/R, Auto SL/TP, HTF panel. No repainting. Built for serious traders.
Bollinger Bands Width
RSI Scalper delivers split‑second entries on volatile assets.
Draws Stoploss and Takeprofit levels based on the ATR indicator.
Pro VSA tool with 3 modes: Fixed Ratios, Standard Deviation & Contextual VSA.
[Hamster-Coder] Pivot Points (Multi Time Frame)
Session boxes & highs/lows for Asian, London and NY to trade liquidity, breakouts and intraday structure.
ALMA Smoothed Gaussian Moving Average (ASGMA) – by LudwigICT
CandleColourFlow MultiFx - optimized to work on Fx Majors, Fx MInors, Fx Crosses
注册日期 15/01/2025
6
销售