
Mô tả
🔍 Xem xét dữ liệu khối lượng trong một khoảng thời gian lịch sử cụ thể, làm nổi bật các khu vực tiềm năng nơi các nhà đầu tư sử dụng đòn bẩy cao có thể đối mặt với việc thanh lý, cung cấp những hiểu biết quý giá về hành vi thị trường.
Chỉ báo này làm gì?
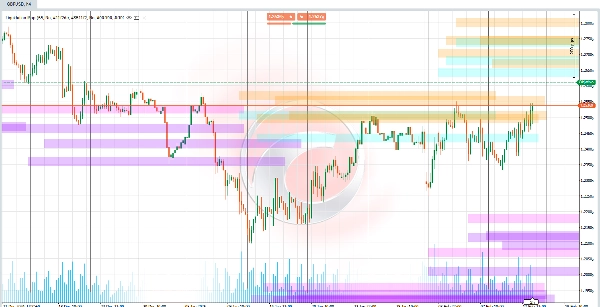
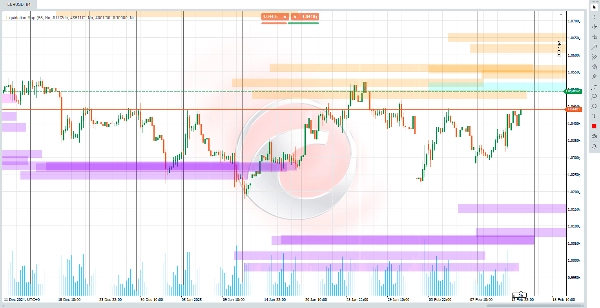
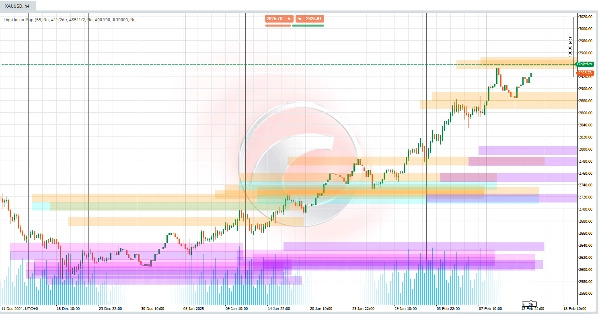
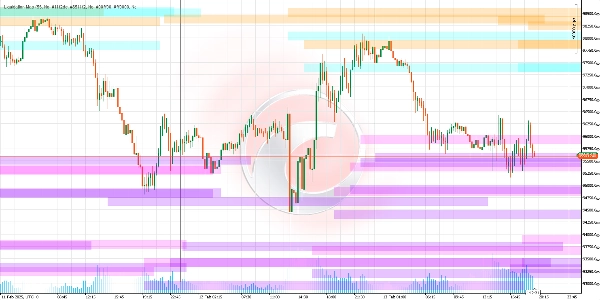
Thuật toán này xác định các mức giá nơi việc thanh lý hàng loạt các vị thế sử dụng đòn bẩy (như 5x, 10x, 25x, 50x hoặc 100x) có khả năng xảy ra. Những mức này hoạt động như "nam châm" cho các biến động giá, vì việc thanh lý có thể kích hoạt các biến động mạnh trên thị trường. Chỉ báo vẽ các đường ngang trên biểu đồ, đại diện cho các ngưỡng này và chiếu chúng vào tương lai để dự đoán các vùng quan trọng.
Các mức này được tính toán như thế nào?
- Phát hiện điểm xoay giá:
🔄 Nó xác định các đỉnh và đáy gần đây trên biểu đồ (các điểm mà giá thay đổi hướng đi). Những điểm xoay này là cơ sở để tính toán các mức thanh lý. - Khối lượng làm kích hoạt:
📊 So sánh khối lượng hiện tại với mức trung bình lịch sử. Nếu khối lượng vượt quá các ngưỡng nhất định (ví dụ, 1.2 lần mức trung bình cho 100x), nó sẽ kích hoạt các mức thanh lý tương ứng. - Công thức thanh lý:
Đòn bẩy càng cao, mức thanh lý càng gần với giá hiện tại. -
- Đối với vị thế mua: Mức thanh lý được đặt dưới đáy điểm xoay, tính toán dựa trên đòn bẩy (ví dụ, thấp hơn 2% cho 50x).
- Đối với vị thế bán: Mức được đặt trên đỉnh điểm xoay, sử dụng nguyên tắc tương tự.
Bạn có thể mong đợi gì khi sử dụng nó?
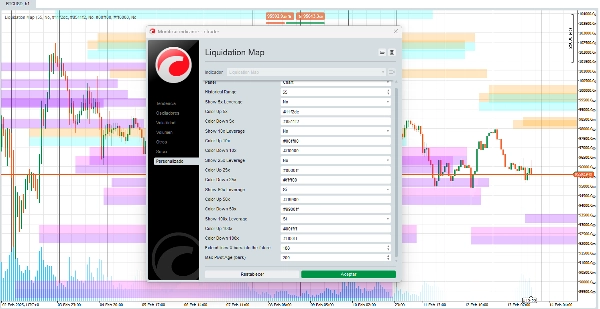
- Đường thanh khoản: 🎨 Bạn sẽ thấy các đường ngang có thể tùy chỉnh đại diện cho các vùng mà thị trường có thể trải qua biến động cao do thanh lý.
- Đòn bẩy có thể cấu hình: ⚙️ Bạn có thể bật/tắt các mức cho từng loại đòn bẩy (ví dụ, chỉ tập trung vào 50x và 100x).
- Tùy chỉnh màu sắc: 🌈 Bạn có thể chọn màu cho từng phạm vi thanh lý, điều chỉnh hình ảnh theo sở thích của bạn.
- Vùng tắc nghẽn: 🎯 Nhiều đường gần nhau cho thấy các khu vực rủi ro cao/lợi nhuận cao nơi nhiều lần thanh lý có thể xảy ra đồng thời.
Cách diễn giải các tín hiệu?
- Giá tiếp cận một đường: 🚨 Nếu giá gần mức thanh lý (đặc biệt với khối lượng cao), khả năng xảy ra biến động mạnh tăng lên.
- Màu sắc và độ trong suốt: 🎨 Màu sắc thay đổi theo đòn bẩy (ví dụ, xanh dương cho 25x, cam cho 50x). Độ trong suốt biểu thị "độ mạnh" của khối lượng liên quan (đường tối hơn = khối lượng quan trọng hơn).
Tại sao nó hữu ích?
- Dự báo chủ động: 🔮 Nó không chỉ phân tích quá khứ; nó chiếu các mức trong tương lai dựa trên điều kiện hiện tại.
- Tập trung vào tâm lý thị trường: 🧠 Việc thanh lý bắt buộc thường tạo ra phản ứng dây chuyền (ví dụ, các lệnh dừng lỗ kích hoạt bán tháo thêm). Chỉ báo này giúp bạn dự đoán chúng.
- Tùy chỉnh: 🛠️ Điều chỉnh hình ảnh theo chiến lược của bạn (ví dụ, ưu tiên đòn bẩy cao hơn trong thị trường biến động).
Những hạn chế cần lưu ý
- Phụ thuộc vào khối lượng: 📉 Nếu khối lượng thấp hoặc dữ liệu lịch sử không đủ, các tín hiệu có thể kém tin cậy hơn.
- Không phải quả cầu pha lê: 🔮 Các mức chỉ ra các vùng có khả năng xảy ra, không phải chắc chắn. Luôn kết hợp với các phân tích khác.
- Môi trường động: 🌍 Trong các thị trường có tin tức bất ngờ, việc thanh lý có thể xảy ra ngoài các mức dự kiến.
Chỉ báo Ctrader Store:
Phiên Chênh lệch Giá Trị Công bằng
Cấu trúc Thị trường Động
Phân tích các Điểm Quay
Fibonacci Tuyến tính
Hồi quy đa khung thời gian
Chênh lệch Giá Trị Công bằng Động lực
Định hướng Nến đa cấp
Bộ theo dõi
Đường Hỗ trợ và
Kháng cự Xu hướng Tự động
Tóm tắt
Đánh giá của khách hàng
5 | 67 % | |
4 | 0 % | |
3 | 33 % | |
2 | 0 % | |
1 | 0 % |


