
설명
일일 평균 피보나치 - 자동 일일 피보나치 레벨
당일 시가를 기준으로 일일 평균 범위를 피보나치 레벨로 투영합니다
이 지표는 무엇을 하나요?
일일 평균 피보나치는 평균 일일 범위를 기반으로 피보나치 레벨을 자동으로 그립니다. 매일 지표는 시가에서 위아래로 주요 레벨을 투영하여 잠재적 목표 및 반전 구역을 식별하는 데 도움을 줍니다.
주요 특징
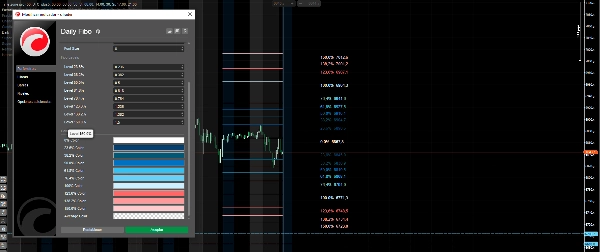
✅ 자동 일일 업데이트 - 레벨이 매일 자동으로 다시 그려집니다 ✅ 사용자 지정 가능한 레벨 - 최대 8개의 서로 다른 피보나치 레벨 구성 가능 ✅ 사용자 지정 색상 - 각 레벨마다 식별 가능한 고유 색상 부여 ✅ 가격이 표시된 라벨 - 각 레벨의 백분율과 정확한 가격 모두 표시 ✅ 조정 가능한 일 평균 - 평균 계산에 사용할 일 수 선택 가능 (기본값 20)
기본 포함 레벨
- 0% - 당일 시가 (기준선)
- 23.6%, 38.2%, 50%, 61.8%, 76.4% - 내부 되돌림 및 확장
- 100% - 전체 평균 범위
- 123.6%, 138.2%, 150% - 외부 확장
지표 사용 방법
- 방향 식별 - 시가(0%)가 기준점입니다
- 강세 목표 찾기 - 상위 레벨은 매수 목표를 표시합니다
- 약세 목표 찾기 - 하위 레벨은 매도 목표를 표시합니다
- 반전 구역 - 가격이 극단적인 레벨(100% 이상)에 도달하면 가능한 반전을 찾으세요
조정 가능한 매개변수
- 평균 계산에 사용할 일 수
- 사용자 지정 피보나치 레벨
- 레벨별 개별 색상
- 라벨 및 가격 표시/숨기기
- 글꼴 크기
거래 세션 동안 명확한 목표와 가능한 가격 구역을 찾는 트레이더에게 완벽합니다.
요약
AI 요약
Daily Fibo is an indicator that automatically projects Fibonacci levels based on the average daily price range, starting from the day's opening price. It redraws these levels each trading day to help identify potential price targets and reversal zones. The indicator includes up to eight customizable Fibonacci levels, ranging from 0% (day's opening) through common retracements (23.6%, 38.2%, 50%, 61.8%, 76.4%) to full and extended ranges (100%, 123.6%, 138.2%, 150%). Each level can be assigned a distinct color and labeled with both the percentage and exact price for clarity. Users can adjust parameters such as the number of days used to calculate the average range, visibility of labels, and font size. This tool supports markets including Forex, Indices, Crypto, and Stocks. Traders can use Daily Fibo to identify bullish and bearish targets relative to the opening price and to anticipate possible reversal points when prices reach extreme Fibonacci extensions.
지표 프로필
고객 리뷰
4.5
리뷰: 2
5 | 50 % | |
4 | 50 % | |
3 | 0 % | |
2 | 0 % | |
1 | 0 % |
고객 리뷰
상담
자주 묻는 질문(FAQ)
Forex
Indices
Crypto
Stocks
트레이딩 봇, 지표, 플러그인 등 cTrader Store에서 제공되는 상품은 제3자 개발자에 의해 제공되며, 이는 단순히 정보 및 기술적 접근을 목적으로 제공된 것입니다. cTrader Store는 중개인이 아니며, 투자 조언, 개인별 추천 또는 향후 성과에 대한 어떠한 보장도 제공하지 않습니다.


가격
가입일 24/02/2025
15
판매
1.84K
무료 설치