지표
RSI
Breakout
XAUUSD
ATR
Commodities
Signal
Supertrend
Crypto
BTCUSD
Market Imbalance
"Market Imbalance" 로고
03/09/2025
440
Desktop
"Market Imbalance" 업로드된 이미지

Pinescriptlabs Store indicators:                        Pinescriptlabs  Store cBots :  (cBot) Gold & BTC BreakoutSession Pivots(new)
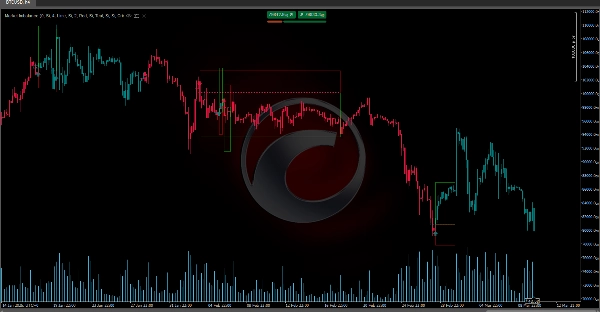
S&R Structural ZigZag                                

ZigZag

 BOS & CHOCH

Zones Supply Demand

Leverage Liquidation Map

Auto-Trend Channel


Volume POC Heatmap


PREMIUM SSL CHANNEL

Prediction Based on Linreg & ATR

 ICT Power of 3 
                                                   

SmartTrend Support &
Resistance
Lines
       

Fair Value Gap Sessions                


RSI Trend Trigger

Channel Breakout System

Supertrend

Market Imbalance

Adaptive Trend Channel 

Dynamic
Market Structure
Analysis
of
Turning
Points

Order Block

Fibonacci
Linear
Regression
Multi-timeframe

Dynamic RSI

Momentum Fair Value Gap

Market Flow Projection

Dynamic Trend Gradient

Multi-Level
Candle Bias
Tracker

Zig-Zag Extremity Tracker

Reactive Moving Average

Auto
Support and
Resistance
Trend
Lines

All
Support and
Resistance
Levels

Dynamic Range Momentum

MarketImbalanceDetector identifies market imbalances and visually marks key areas based on price patterns and volatility (ATR). Here’s a simple breakdown of how it works:

🔍 Signal Detection

It compares prices of previous bars to detect bullish or bearish patterns. Using specific conditions (like comparing lows and highs of previous bars) and filtering signals with current volatility, it ensures the movement is significant.

📊 Visualizing Imbalances

When a signal is identified, the indicator draws on the chart:

  • An Imbalance Area (a rectangle) marking the zone where the pattern occurred.
  • An Average Level Line (calculated from relevant highs and lows) to help visualize support or resistance.
  • An Icon (an arrow) indicating the signal direction (⬆️ for bullish, ⬇️ for bearish).

OP/PE Zones

Additionally, it creates zones called OP () and PE (Escape Point). These zones are calculated by adding or subtracting a multiple of the ATR to the average level, helping define areas for taking profit or cutting losses.


0.0
리뷰: 0
고객 리뷰
이 상품에 대한 리뷰가 아직 없습니다. 이미 사용해 보셨나요? 다른 사람들에게 가장 먼저 소개해 주세요!
이 작성자의 상품 더 보기
최고 평점
무료
지표
RSI
Breakout
XAUUSD
+6
ZigZag
ZigZag filters noise, spots trends, patterns, pivots, aiding analysis, trade management, and confirmations. 📉📈
지표
RSI
Breakout
XAUUSD
+6
Order Block
Identify bullish and bearish Order Blocks to spot key support/resistance levels and potential trend reversals! 📈🔄
지표
RSI
Breakout
XAUUSD
+5
Auto-Trend Channel
Adaptive trend channel using linear regression and Pearson correlation for dynamic support, resistance, and trends.
지표
RSI
XAUUSD
Breakout
+5
BOS & CHOCH
Market structural patterns , specifically the concepts of Change of Character (ChoCH) 🔄 and Break of Structure (BoS) 💥
지표
RSI
Breakout
XAUUSD
+5
Zones Supply Demand
📊Zones Supply & Demand: Identifies key price levels with high volume concentration, marking Supply/Demand Zones & Marke
지표
RSI
Breakout
Supertrend
All Support and Resistance Levels
"Identify key market zones and visualize support/resistance from multiple timeframes on a single chart.
지표
RSI
Breakout
XAUUSD
+6
Volume POC Heatmap
📊 Shows volume by price levels, highlights POC, and key zones. Identifies dynamic support/resistance and imbalances.
지표
RSI
Breakout
XAUUSD
+5
Supertrend
💹 Define a price channel 📈 and determine trend direction (bullish 🟢 or bearish 🔴).
지표
RSI
Breakout
XAUUSD
+6
Fair Value Gap Sessions
identify and highlight temporary market inefficiencies known as "fair value gaps" 🚨 within specific trading Sessions.
지표
RSI
Breakout
XAUUSD
+4
Dynamic Market Structure Analysis of Turning Points
Identify market structure effortlessly with swing highs, lows, CHoCH, and BOS levels for smart trading decisions! 📊🔍"
지표
Indices
RSI
XAUUSD
+7
RSI Divergence
Detects bullish and bearish divergences
지표
RSI
Breakout
Supertrend
Trend Heikin Multi MA
🚀 TrendHeikinMultiMA: Advanced trend detection using Heikin-Ashi smoothing & MAs! Eliminates noise, confirms real trend
지표
RSI
Breakout
XAUUSD
+4
Multi-Level Candle Bias Tracker
Price direction by calculating the probability of reaching new highs/lows. Shows levels & stats📈
지표
RSI
Breakout
Supertrend
Leverage Liquidation Map
📊 Liquidation Map: Potential areas where highly leveraged investors might face liquidations.
지표
RSI
Breakout
Supertrend
Market Trend OB
Price action to detect when the market changes trend (MSB) and defines, order blocks , ZigZag etc.📊
지표
RSI
Breakout
Supertrend
Zig-Zag Extremity Tracker
Dynamically adjusts regression channels based on ZigZag extremes, resetting when price breaks bands to track real trends
지표
RSI
Breakout
Supertrend
Swing Levels
🔍 Automatically detect support and resistance levels based on "swings" or pivots
Advanced Market Structure Bos,Choch,SwinLevels, Order Blog
Advanced price action tool that combines multiple technical analysis concepts
좋아하실 만한 다른 항목
Repiptor Candlescope Lite
Candlestick pattern detector lite version
지표
ATR
Forex
Signal
+4
Follow Line
The Follow Line Indicator is a versatile tool designed to identify market trends and provide accurate buy/sell signals.
지표
Breakout
VIX - volatility indicator
Ride the Volatility – Smart VIX Tool
지표
Breakout
Stocks
Commodities
+1
Advanced Donchian Zones
MTF Donchian: Identify trend breakouts & key zones with precision. Perfect for swing & day traders seeking accuracy!
지표
XAUUSD
Commodities
Forex
+3
Silver Bullet by LudwigICT
Breakout Mode Patterns
Brooks price action breakout mode patterns
지표
Indices
Prop
Stocks
+3
IRiskRewardTools
Risk Reward Management Tools(风险回报管理工具)
지표
Signal
MACD
USDJPY
PulseTracker
Version 1.2: Advanced Trend Detection & Visualization System
지표
ZigZag
NAS100
RSI
+7
WAVETREND_withSourceCode
The WaveTrend Indicator is a multifunctional oscillator designed to center the trend wave or movements in the trend.
pATR
An indicator that redefines ATR by applying a percentile-based filter giving traders a grounded view of volatility.
지표
Forex
ms_Candle_ColseTime
⏱ Candle Time Remaining – Real-Time Candle Countdown Indicator
지표
RSI
Breakout
XAUUSD
+6
Multi-Asset Performance Matrix
Visual tool tracking financial assets' % performance across timeframes, highlighting trends with color-coded insights.
[Stellar Strategies] Market Session Ultimate
Ultimate Session Tool: Boxes, OR, KZs, PD Levels, Overlaps, Custom Lines & Names, Info Panel! Highly customizable 📉📈
지표
Breakout
Signal
Bollinger
[Hamster-Coder] Bollinger Bands
Bolliger Bands + Hamster-Coder™ Timeframe Decoupling
지표
Breakout
ATR
LT_SmartSwings
Detects swing highs/lows, structure, breakouts, trend lines, and fibs — great for price action trading.
Tabajara corrigido[fix]
corrigido todos os bugs e cores invertidas tabajara antigo deleetado
calculateSpreads_withSourceCode
Indicator calculates spread in pips
지표
XAUUSD
Martingale
Commodities
+2
cAlgoBuddy - Zone Recovery
The Zone Recovery indicator is used in an advanced hedging strategy, opening traders in the opposite direction.