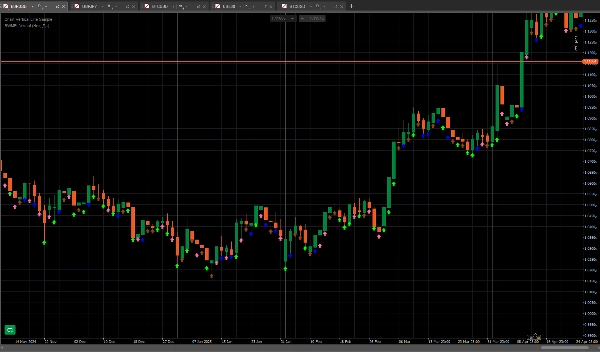
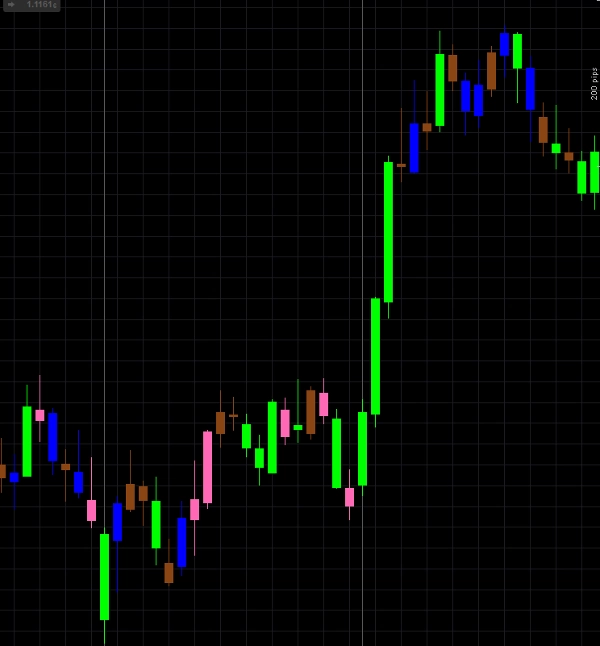
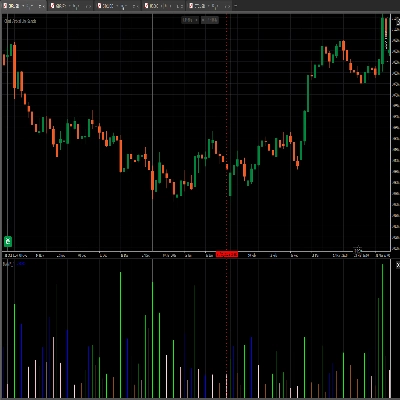
"BWMFI_Visual" 로고
BWMFI_Visual
0.0
03/09/2025
23
Desktop

BW_MFI Vizual colors bars

More from this author
좋아하실 만한 다른 항목
지표
signal
FAMA-MAMA
The FAMA-MAMA Indicator is a powerful, adaptive trend-following tool designed for professional and algorithmic traders.
지표
bollinger
E7 Indicators Free Studies
ADXR, KDJ, SineWave, Bollinger Band Volatility and AEOscillator.
Gold Candle 100 Range
Dynamic, color‑coded candles reveal market shifts instantly—spot momentum and trend reversals at a glance
지표
forex
ai
prop
+7
Vwap Manav Indi Button
Automated VWAP bot executes trades at key volume-weighted average price zones with adaptive risk management
Ctrader Liniar Chart
Simple and efficient Indicator Designed to be profitable .With alarms for trend changes and support - resistance
Time To Break Even Indicator v2
Time To Break Even Indicator. This indicator helps you time your trade's entry.
지표
breakout
forex
commodities
+3
MAGIC BLOCK STRATEGY
Block Liquidity,indicator.Block Order, Liquids Stops, Signal Sentiment,signal correction
지표
forex
bollinger
indices
+5
REDGREENZONEREVERSAL
The Red & Green Zone Reversal Indicator detects overbought and oversold market conditions using Bollinger Bands and RSI.
IR Moving Average
 this moving include everything that a trader needs from Moving Average.
지표
signal
[Stellar Strategies] Wave Trend Pro
Momentum oscillator identifying reversals using dual WaveTrend lines, histogram, and OB/OS levels with optional signals.
Binary Options Signals Pro
Binary Options Signals Pro – Precision Trading at Your Fingertips
지표
rsi
macd
Multi-Timeframe Market Levels
Unlock market insights with our Multi-Timeframe Market Levels indicator, enhancing your trading strategies effortlessly
지표
breakout
btcusd
supertrend
+5
BOS & CHOCH
Market structural patterns , specifically the concepts of Change of Character (ChoCH) 🔄 and Break of Structure (BoS) 💥
지표
bollinger
E7 Indicators Free Overlays
Bollinger Band Cloud, Heiken Ashi, Trend Follower and Parabolic SAR.
지표
bollinger
commodities
rsi
+1
Dot Momentum %BB Indicator
Dynamic circles visualize price's volatility position. Like RSI for market overextension & stretch. Quantify context.
지표
breakout
btcusd
supertrend
+6
Market Imbalance
Identifies market imbalances and visually marks key areas based on price patterns and volatility (ATR).
RSI T3 Overbought and oversold areas
Three parameter RSI
Candelstick xxl
The indicator is designed to detect aggressive movements in the market and without volume for trend changes.