
설명
설명
Pinescriptlabs 스토어 지표: 🤖Pinescriptlabs 스토어 cBots :
ICT Power of 3 (cBot) Gold & BTC BreakoutSession Pivots(new)YieldShield"
SmartTrend Support &
Resistance Lines
Dynamic Market Structure
Analysis of Turning Points
Fibonacci Linear
Regression Multi-timeframe
Multi-Level Candle Bias
Tracker
Auto Support and
Resistance Trend Lines
All Support and
Resistance Levels
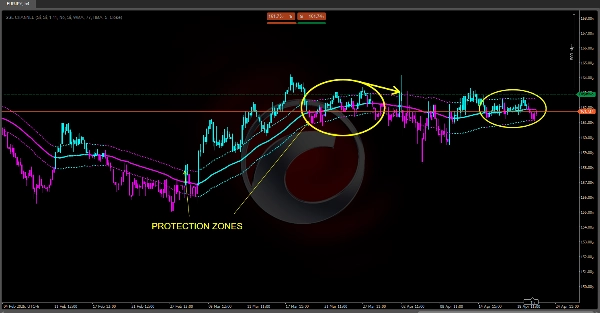
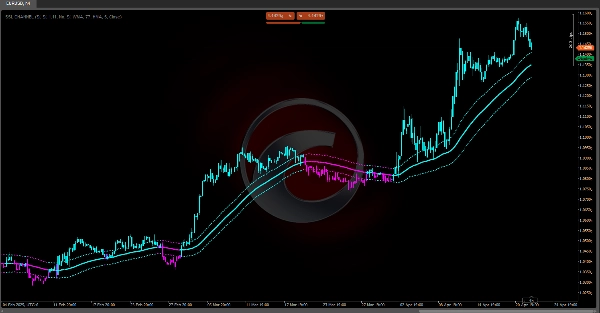
프리미엄 SSL 채널 🔍
이동 평균을 통한 추세 감지, ATR 기반 밴드를 통한 변동성 평가, 그리고 단기 필터(SSL)를 결합하여 통합 분석 시스템을 제공합니다. 💡 이 지표의 강점은 시각적 신호의 명확성과 시장 전반에 걸친 적응성에 있으며, 주요 과제는 지연 최소화와 횡보 움직임 필터링입니다. 적절한 매개변수 설정 시, 거래의 진입/퇴출 결정에 강력한 도구가 됩니다. 🎯
1. 목적 및 거래 유용성 📊
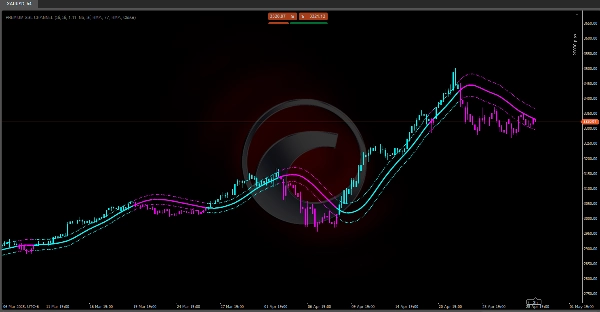
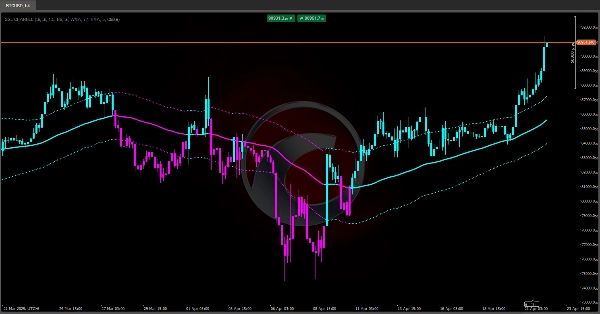
• 주요 추세 감지: 중앙선("기준선") 덕분에 지표가 시장의 지배적 방향을 보여줍니다. 📈📉
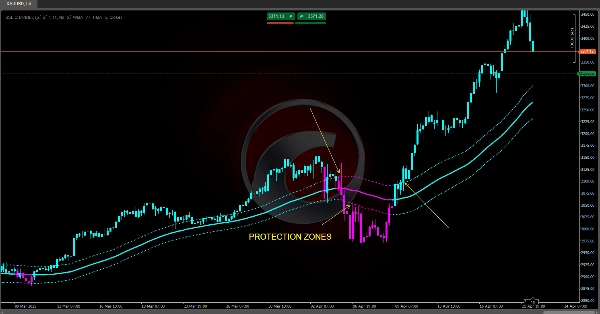
• 변동성 측정: 평균 범위(ATR)를 사용하여 기준선 위/아래 두 밴드를 동적 지지/저항 구간으로 조정합니다. ⚡
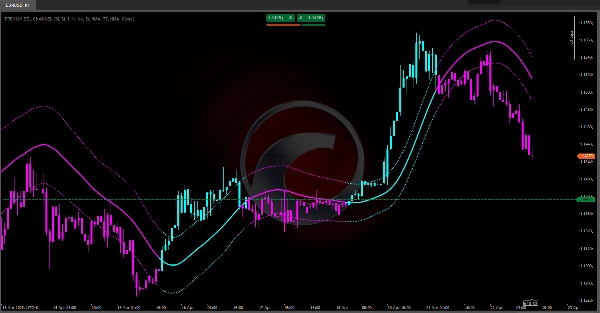
• 노이즈 필터 및 편향 전환: SSL 채널(고점/저점을 기반으로 한 적응형 이동 평균)이 단기 반전을 식별하여 정확한 진입/퇴출을 돕습니다. 🔄
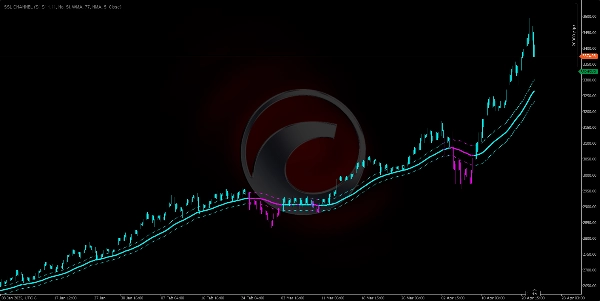
• 직관적 시각화: 가격 막대와 선을 편향에 따라 색칠(청록색 = 강세, 마젠타 = 약세)하여 즉각적인 해석이 가능합니다. 🎨
2. 핵심 구성 요소 및 논리 ⚙️
2.1. 중앙선 ("기준선")
• 노이즈를 부드럽게 하기 위해 가격 이동 평균(SMA, EMA, WMA 또는 Hull)을 계산합니다.
• 시장의 평균 가치를 나타내며, 지배적 추세를 보여줍니다:
- 가격이 위에 있을 때 → 강세 추세. 🟢
- 가격이 아래에 있을 때 → 약세 추세. 🔴
2.2. 평균 범위 (ATR)
• 이전 고점/저점/종가를 평균하여 실제 시장 변동성을 측정합니다.
• 높은 ATR = 더 큰 변동성; 낮은 ATR = 더 안정된 시장. 🌊
2.3. 동적 밴드 ("상향 ATR" 및 "하향 ATR")
• 상향 ATR = 기준선 + (ATR × 배수)
• 하향 ATR = 기준선 – (ATR × 배수)
• 가격 채널 역할을 합니다:
- 가격이 상단 밴드에 닿으면 → 강세 강도. 🚀
- 가격이 하단 밴드 근처에 있으면 → 약세 모멘텀. 🐻
2.4. SSL 채널 (신호-부드러운-선)
• 고점과 저점에 대해 별도로 이동 평균을 사용합니다.
• 방향 논리:
- 종가가 고가 이동 평균 위에 있으면 → 강세 편향. ✅
- 종가가 저가 이동 평균 아래에 있으면 → 약세 편향. ❌
- 중간에 있으면 → 이전 편향 유지.
• 기준선을 확인하거나 반박하는 단기 추세 필터 역할을 합니다. 🔄
3. 신호 생성 및 실용적 사용 🛠️
1. 추세 확인
- 강한 강세: 가격 > 상향 ATR. 🟢
- 중간 강세: 상향 ATR > 가격 > 기준선.
- 중간 약세: 기준선 > 가격 > 하향 ATR.
- 강한 약세: 가격 < 하향 ATR. 🔴
2. SSL 필터
- 진입: SSL이 자신의 선 위에 있을 때만 롱 진입(또는 아래에 있으면 숏). ⬆⬇
- 퇴출: SSL이 반전하여 반대 고가/저가 이동 평균을 교차할 때 부분/전체 퇴출. ✋
3. 바 색칠
- 가격 막대가 청록색(강세) 또는 마젠타(약세)로 변하며, 기준선과 동기화되어 빠른 시장 해석이 가능합니다. 🎨
4. 구성 가능한 매개변수 및 영향 ⚖️
• 기준선 기간: 길면 부드럽지만 지연; 짧으면 반응 빠르지만 노이즈 많음. 🐢⚡
• 밴드 배수: 높으면 채널 넓음(거짓 신호 적음); 낮으면 채널 좁음(신호 많고 휘핑 많음). ↔️
• 이동 평균 유형 (SMA/EMA/WMA/HMA): 최근 가격과 과거 가격의 가중치에 영향. 📅
• SSL 기간 및 유형: 단기 필터 민감도 정의. 🎚️
요약
고객 리뷰
5 | 100 % | |
4 | 0 % | |
3 | 0 % | |
2 | 0 % | |
1 | 0 % |


!["[Stellar Strategies] Inside Bar with Signals" 로고](https://cdn.ctrader.com/image/webp/1d9e8bfa-3b2c-4440-bb37-5856902008a7_30683)


