
설명
3-바 반전
📊 이것은 무엇인가요?
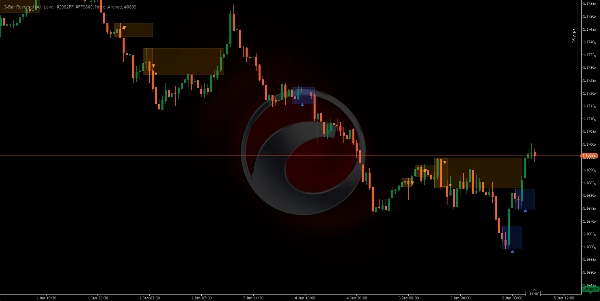
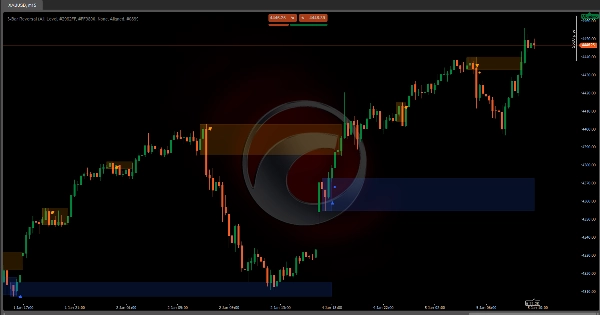
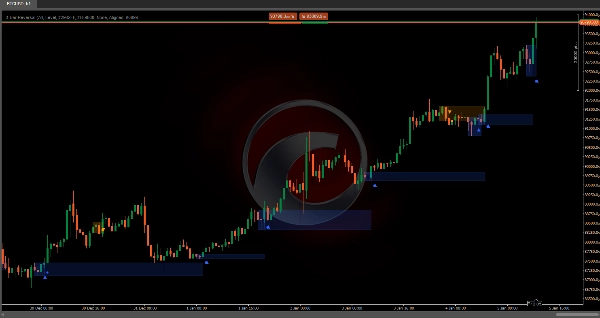
이 3-바 반전은 정확히 세 개의 연속된 캔들로 형성된 특정 반전 패턴을 식별하는 기술적 지표입니다. 이 고전적인 패턴은 추세 캔들, 소진 캔들, 반전 캔들로 구성된 명확한 시각적 구조를 통해 가격 방향의 잠재적 변화를 신호합니다.
🎯 이것은 무엇을 위한 것인가요?
이 지표는 트레이더가 다음을 할 수 있도록 돕습니다:
- 3캔들 구조로 강세 및 약세 반전을 감지
- 구성 가능한 추세 확인을 통해 잘못된 신호를 필터링
- 확인된 패턴을 기반으로 지지 및 저항 구역을 식별
- 직관적인 차트 마커로 거래 기회를 시각화
- 모든 타임프레임에서 높은 확률의 반전을 거래
🔍 어떻게 작동하나요?
강세 패턴 (3-바 강세 반전)
세 개의 캔들 구조:
- 캔들 1 (약세): 시가보다 종가가 낮음 - 매도 압력 확인
- 캔들 2 (소진 약세): 캔들 1보다 낮은 저점과 새로운 고점을 만들고, 약세 종가 - 항복 신호 ⚠️
- 캔들 3 (강세 반전): 시가보다 종가가 높고 캔들 1의 고점 위로 상승 - 지배력 전환 확인 ✅
약세 패턴 (3-바 약세 반전)
반대 구조:
- 캔들 1 (강세): 시가보다 종가가 높음 - 매수 압력 확인
- 캔들 2 (확장 강세): 캔들 1보다 높은 고점과 새로운 저점을 만들고, 강세 종가 - 과도 확장 신호 ⚠️
- 캔들 3 (약세 반전): 시가보다 종가가 낮고 캔들 1의 저점 아래로 하락 - 지배력 전환 확인 ✅
시각적 관리 시스템 (상태 기계)
이 지표는 각 패턴을 세 단계로 순차적으로 처리합니다:
1단계 - 패턴 감지: 🔍
- 완전한 3캔들 구조가 식별됩니다
- 세 번째 캔들에 삼각형 지표 (▲ 강세 / ▼ 약세)가 나타납니다
- 다음 구간을 덮는 반투명 설정 사각형이 그려집니다:
-
- 강세: 캔들 1의 고점부터 가장 낮은 저점(캔들 2 또는 3)까지
- 약세: 캔들 1의 저점부터 가장 높은 고점(캔들 2 또는 3)까지
- 이 사각형은 반전이 발생한 "전투 구역"을 표시합니다
2단계 - 확인 또는 무효화: ⏳
시스템은 패턴 다음 캔들을 기다려 이를 검증합니다:
강세 확인: ✅
- 다음 캔들의 종가가 캔들 1의 고점(사각형 천장)을 초과해야 합니다
- 확인을 표시하는 실선 점 (●)이 나타납니다
- 사각형은 활성 지지 구역이 됩니다
약세 확인: ✅
- 다음 캔들의 종가가 캔들 1의 저점(사각형 바닥)을 돌파해야 합니다
- 확인을 표시하는 실선 점 (●)이 나타납니다
- 사각형은 활성 저항 구역이 됩니다
무효화: ❌
- 강세 실패 조건: 사각형 최저점 아래 종가 또는 약세 패턴 출현
- 약세 실패 조건: 사각형 최고점 위 종가 또는 강세 패턴 출현
- 사각형 확장이 멈춤 (패턴 소멸)
확장 대기: ⏸️
- 확인 또는 실패가 없으면 사각형이 캔들별로 수평 확장됩니다
3단계 - 활성 지지/저항 구역: 🎯
- 확인되면 구역이 오른쪽으로 무한히 확장됩니다
- 강세 구역: 가격이 바닥 위에 있는 동안 활성 상태 유지
- 약세 구역: 가격이 천장 아래에 있는 동안 활성 상태 유지
- 가격이 완전히 반대 방향으로 돌파하면 구역이 비활성화됩니다
⚙️ 주요 설정
패턴 모드
허용되는 패턴 변형을 제어합니다:
- 일반: 캔들 3가 캔들 1 범위 내에서 닫힐 때만 허용
-
- 강세: 종가 < 캔들 1의 고점 (중간 반전)
- 약세: 종가 > 캔들 1의 저점 (중간 반전)
- 향상됨: 캔들 3가 캔들 1 범위 밖에서 닫힐 때만 허용 🔥
-
- 강세: 종가 > 캔들 1의 고점 (폭발적 반전)
- 약세: 종가 < 캔들 1의 저점 (폭발적 반전)
- 전체 (권장): 두 유형 모두 구분 없이 허용 ⭐
지지/저항 유형
- 레벨: 기본 선 기능 (이 버전에서는 제한적)
- 구역: 확인 후 SR 구역을 표시하는 음영 사각형 그리기 📦
- 없음: SR 구역 없이 감지된 패턴만 표시
사용자 지정 색상 🎨
- 강세 반전 색상: 삼각형, 사각형 및 강세 구역용 (기본값:
#2962FF- 파랑) - 약세 반전 색상: 삼각형, 사각형 및 약세 구역용 (기본값:
#FF9800- 주황) - 강세 추세 색상: 추세 필터 시각화용 (기본값:
#089981- 초록) - 약세 추세 색상: 추세 필터 시각화용 (기본값:
#F23645- 빨강)
🔧 추세 필터
이 지표는 네 가지 방법을 사용하여 전체 추세 방향에 따라 패턴을 필터링할 수 있습니다:
1. 이동평균 클라우드 ☁️
두 개의 이동평균을 사용하여 추세를 식별합니다:
매개변수:
- 이동평균 유형: 단순, 지수, 헐, 가중 등 (기본값: 헐)
- 빠른 기간: 50 (기본값)
- 느린 기간: 200 (기본값)
필터 논리 (정렬됨):
- 강세 추세 감지 조건: 가격 > 빠른 MA 그리고 빠른 MA > 느린 MA ✅
- 약세 추세 감지 조건: 가격 < 빠른 MA 그리고 빠른 MA < 느린 MA ✅
- 강세 추세에서는 강세 패턴만, 약세 추세에서는 약세 패턴만 표시
반대 논리 (반대):
- 주요 역추세 반전을 포착하기 위해 조건을 반전시킵니다
2. 슈퍼트렌드 📈
변동성 기반 추세 추종 지표 (ATR):
매개변수:
- ATR 기간: 10 (기본값) - 변동성 계산 창
- 배수 인자: 3.0 (기본값) - 지표 민감도
논리:
- ATR을 사용하여 상단 및 하단 밴드를 계산합니다
- 가격이 슈퍼트렌드 위에 있으면 강세 추세 🟢
- 가격이 슈퍼트렌드 아래에 있으면 약세 추세 🔴
- 구성된 정렬에 따라 패턴을 필터링합니다
3. 돈치안 채널 📊
기간 동안 가격 극단값을 사용합니다:
매개변수:
- 채널 길이: 13 (기본값)
논리:
- 상단 채널 = N 기간 중 최고 고점
- 하단 채널 = N 기간 중 최저 저점
- 중간점 = (상단 + 하단) / 2
- 가격이 중간점 위에 있으면 강세 추세 🟢
- 가격이 중간점 아래에 있으면 약세 추세 🔴
4. 없음 (필터 없음) 🔓
전체 3-바 패턴을 전체 추세와 상관없이 모두 표시합니다. 다음에 유용합니다:
- 횡보장
- 순수 패턴 분석
- 어떤 상황에서도 반전 거래
추세 정렬
필터가 활성화된 경우 적용:
- 정렬됨: 식별된 추세와 일치하는 패턴만 표시 ➡️
-
- 강세 추세에서는 강세 패턴만
- 약세 추세에서는 약세 패턴만
- 반대: 식별된 추세와 반대되는 패턴만 표시 🔄
-
- 약세 추세에서 강세 패턴 (주요 반전)
- 강세 추세에서 약세 패턴 (주요 반전)
요약
AI 요약
The 3-Bar Reversal indicator identifies specific bullish and bearish reversal patterns formed by exactly three consecutive candles. It detects a classic three-candle structure consisting of a trend candle, an exhaustion candle, and a reversal candle, signaling potential price direction changes. The indicator visually marks these patterns on charts with triangles and semi-transparent rectangles highlighting the "battle zone" where reversals occur.
It operates in three phases: pattern detection, confirmation or invalidation based on the next candle's behavior, and establishing active support or resistance zones that extend while price respects them. The indicator supports configurable pattern modes (Normal, Enhanced, or All) to control acceptance criteria for reversals.
Trend filtering is available through four methods—Moving Average Cloud, Supertrend, Donchian Channels, or no filter—allowing users to align pattern signals with overall market trends or capture counter-trend reversals. Confirmed reversal zones are displayed as shaded rectangles or levels, customizable in color for bullish and bearish signals, trend filters, and zones.
This tool is designed for use on any timeframe and across various markets, including forex pairs (EURUSD, GBPUSD, USDJPY, NZDUSD), commodities (XAUUSD), indices (NAS100), and cryptocurrencies (BTCUSD). It aids traders in detecting high-probability reversals, filtering false signals, and identifying support and resistance zones with clear visual markers.
지표 프로필
고객 리뷰
0.0
리뷰: 0
고객 리뷰
이 상품에 대한 리뷰가 아직 없습니다. 이미 사용해 보셨나요? 다른 사람들에게 가장 먼저 소개해 주세요!
상담
자주 묻는 질문(FAQ)
BTCUSD
Signal
EURUSD
Supertrend
GBPUSD
NZDUSD
XAUUSD
NAS100
ATR
USDJPY
트레이딩 봇, 지표, 플러그인 등 cTrader Store에서 제공되는 상품은 제3자 개발자에 의해 제공되며, 이는 단순히 정보 및 기술적 접근을 목적으로 제공된 것입니다. cTrader Store는 중개인이 아니며, 투자 조언, 개인별 추천 또는 향후 성과에 대한 어떠한 보장도 제공하지 않습니다.


가격
가입일 03/10/2024
163
판매
39.09K
무료 설치