
Penerangan
GAMBARAN
Penunjuk Balance of Power mengukur kekuatan pembeli berbanding penjual dengan menilai keupayaan setiap pihak untuk menolak harga ke tahap ekstrem.
Diperkenalkan oleh Igor Levshin dalam isu Ogos 2001 majalah Technical Analysis of Stocks & Commodities, BOP mengira nisbah pergerakan harga dalam julat setiap bar untuk mendedahkan dinamik kekuatan dalaman yang bebas daripada arah harga.
KONSEP
Balance of Power mengukur di mana harga ditutup dalam julat setiap bar untuk mendedahkan pertarungan dalaman antara pembeli dan penjual.
Prinsip asasnya mudah: pembeli menolak harga ke arah tinggi, penjual menolak ke arah rendah. Di mana harga akhirnya ditutup dalam julat itu mendedahkan siapa yang menguasai tempoh dagangan.
Nilai mentah dilicinkan menggunakan purata bergerak untuk mengurangkan bunyi dan mendedahkan tekanan arah yang berterusan, mengubah bacaan bar demi bar yang tidak menentu menjadi pengukur momentum yang bersih yang mengesan peralihan kawalan pasaran.
APLIKASI STRUKTUR PASARAN
BOP menyediakan analisis kekuatan dalaman yang boleh mengesahkan atau menentang struktur harga:
Pengenalpastian Fasa Trend
- Uptrend kuat: BOP sentiasa di atas sifar dengan paras rendah yang lebih tinggi
- Downtrend kuat: BOP sentiasa di bawah sifar dengan paras tinggi yang lebih rendah
- Konsolidasi: BOP berayun sekitar garis sifar
- Zon peralihan: BOP memecahkan struktur sebelumnya (paras tinggi lebih tinggi/rendah lebih rendah)
Konfluens Sokongan/Perlawanan
- BOP kembali ke sifar sering bertepatan dengan harga menguji paras utama
- Bacaan ekstrem BOP (+0.8 hingga +1.0 atau -0.8 hingga -1.0) mungkin menunjukkan keletihan berhampiran struktur
- Divergensi pada paras struktur mencadangkan potensi penolakan atau penembusan
Pengagihan/Pengumpulan
- Harga meningkat dengan BOP menurun: fasa pengagihan berpotensi
- Harga menurun dengan BOP meningkat: fasa pengumpulan berpotensi
- Divergensi ini paling signifikan berhampiran paras struktur utama
STRATEGI PELBAGAI JANGKA MASA
Menggunakan BOP merentasi jangka masa memberikan konteks dan ketepatan:
1. Jangka Masa Lebih Tinggi (HTF) - Bias Arah:
- BOP Harian/4H di atas sifar → cari peluang beli pada jangka masa lebih rendah
- BOP Harian/4H di bawah sifar → cari peluang jual pada jangka masa lebih rendah
- BOP HTF melintasi sifar → peralihan trend utama, tunggu pengesahan
2. Jangka Masa Lebih Rendah (LTF) - Masa Masuk:
- BOP 1H/15M selari dengan HTF → setup kebarangkalian tinggi
- Persilangan BOP/Signal LTF dalam arah HTF → pencetus masuk
- Pengembangan histogram LTF mengesahkan momentum
3. Penyelarasan Jangka Masa:
- Semua jangka masa sependapat → dagangan dengan keyakinan paling kuat
- HTF dan LTF berbeza arah → tunggu penyelesaian atau elak dagangan
- Pembalikan LTF bertentangan dengan HTF → potensi scalp lawan trend sahaja
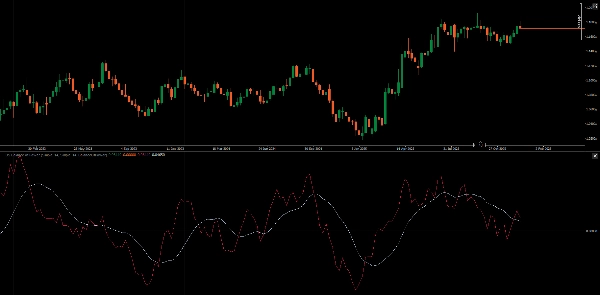
GARIS ISYARAT & HISTOGRAM
Garis Isyarat (MA BOP):
- Persilangan BOP/Garis Isyarat memberikan isyarat masuk/keluar yang ditapis
- Cerun garis isyarat menunjukkan ketahanan momentum
- Jarak antara BOP dan Garis Isyarat menunjukkan lanjutan pergerakan
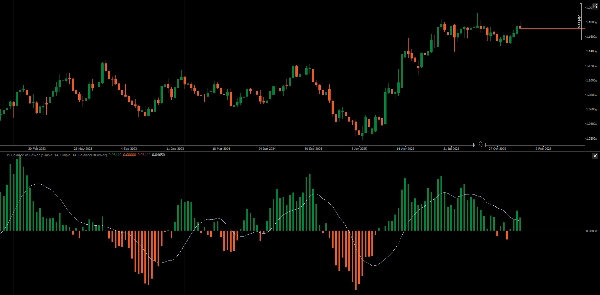
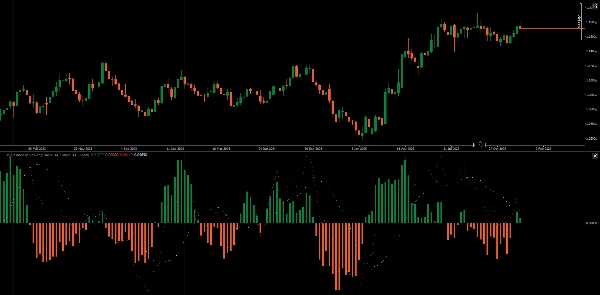
Mod Histogram:
- Mod Nilai: Menunjukkan polariti BOP berbanding sifar (dominasi pembeli/penjual)
- Mod Isyarat: Menunjukkan perbezaan BOP - Isyarat, mendedahkan peralihan momentum lebih awal daripada persilangan
Dalam mod Isyarat, persilangan garis sifar histogram berlaku sebelum persilangan garis BOP/Isyarat, menawarkan amaran awal perubahan momentum.
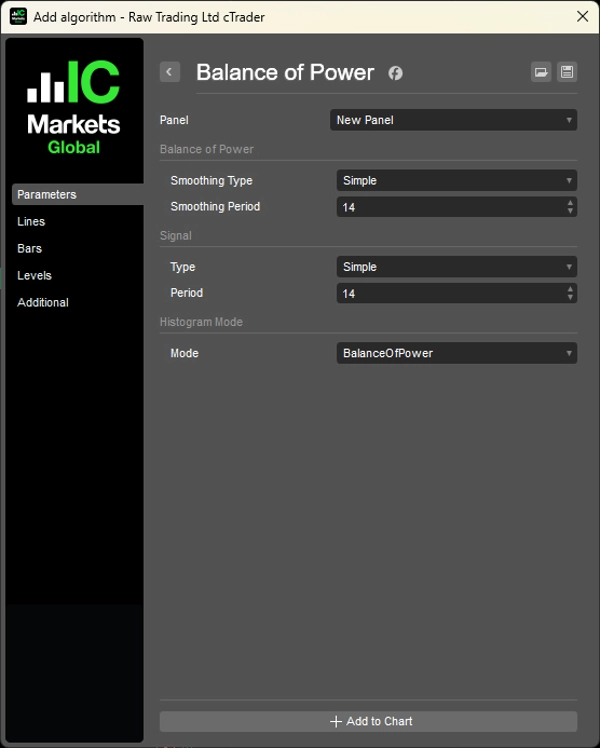
CIRI-CIRI
- Tempoh Pelicinan: Tempoh MA boleh laras untuk BOP (default 14)
- Jenis Pelicinan: Pilihan jenis MA (SMA, EMA, dll.)
- Tempoh Isyarat: Tempoh MA boleh laras untuk garis Isyarat (default 14)
- Jenis Isyarat: Pilihan jenis MA untuk garis Isyarat
- Mod Histogram: Tukar antara paparan Nilai dan perbezaan Isyarat
CONTOH PRAKTIKAL
- HTF (Harian): BOP di atas sifar dan meningkat → bias bullish
- Harga menarik balik ke sokongan
- LTF (1H): BOP melintasi di atas Isyarat → pencetus masuk
- Histogram (mod Isyarat) mengembang → mengesahkan pecutan momentum
- Keluar apabila histogram LTF mengecut atau BOP melintasi di bawah Isyarat
__________________________________________________________________________________________
LAGI PENUNJUK PERCUMA
Terokai pelbagai alat analisis pasaran—daripada struktur dan volum kepada regresi, volatiliti, dan jangka masa tersuai.
Kod sumber tersedia di repositori GitHub repository.
Semua percuma untuk digunakan. Tetapi jika anda ingin menyokong dengan kopi, anda boleh salurkan ia di sini.
Sokongan/Perlawanan
Volum
- Volume Activity Profiler
- Volume Efficiency Analyzer
- Volume Profile Analytics
- Volume Profile - Updated
- Volume Spread Analysis
- VWAP (Volume Weighted Average Price)
Purata Bergerak
- SSL Channel
- Anchored Moving Average
- Deviation-Scaled Moving Average
- Gann High Low Activator
- Instantaneous Trendline
- Kaufman Adaptive MA with Trend Vision
- Moving Average Channel
- Moving Averages Suite
- Trend Channel Moving Average
Utiliti/Tersuai
Berasaskan Regresi
Volatiliti
Osilator
__________________________________________________________________________________________
PENAFIAN
Perdagangan melibatkan risiko. Penunjuk ini bertujuan untuk analisis teknikal sahaja — sentiasa gunakan pengurusan risiko yang betul dan berdagang dengan bertanggungjawab.
MAKLUMBALAS & PENAMBAHBAIKAN
Jika anda mempunyai cadangan, permintaan ciri, atau idea untuk penambahbaikan, sila tinggalkan komen di tab Perbincangan. Maklumbalas anda membantu meningkatkan penunjuk untuk semua orang.
Ringkasan
Key functionalities include identifying trend phases—strong uptrends, downtrends, consolidation, and transition zones—by observing BOP behavior relative to the zero line. It also aids in detecting support and resistance confluence, with extreme BOP readings indicating potential exhaustion near key levels and divergences signaling possible rejections or breakthroughs. The indicator helps identify distribution and accumulation phases through price and BOP divergences.
BOP supports multi-timeframe analysis: higher timeframes provide directional bias, while lower timeframes offer entry timing signals via BOP and signal line crossovers and histogram momentum confirmation. The signal line is a moving average of BOP, with crossovers serving as filtered entry/exit triggers. The histogram can display either BOP polarity or the difference between BOP and its signal line, offering early momentum shift warnings.
Adjustable parameters include smoothing periods and types for both BOP and signal lines, and histogram display modes. The indicator is applicable across Forex, indices, commodities, cryptocurrencies, and stocks markets.


