Mô tả
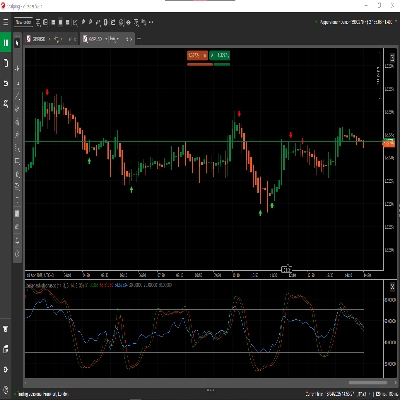
Tính toán các mức hỗ trợ và kháng cự bằng cách sử dụng năm phương pháp pivot chuyên nghiệp trên bất kỳ khung thời gian nào.
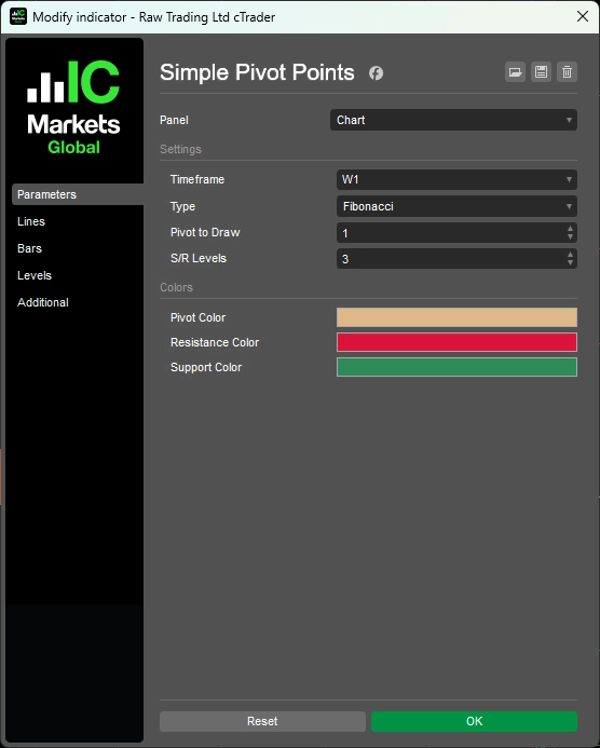
Tự động tạo các mức pivot (Chuẩn, Fibonacci, Woodie, Camarilla, DeMark) từ dữ liệu M5 đến hàng tháng với hiển thị giới hạn thời gian cho mỗi kỳ.
Năm thuật toán tính toán với logic khoảng cách S/R riêng biệt, các mức hỗ trợ/kháng cự có thể cấu hình (0-6 mỗi bên), hiển thị pivot lịch sử cho nhiều kỳ trước, các đường được gán nhãn tự động (PP, R1-R6, S1-S6), và trực quan hóa mã màu cung cấp phân tích pivot cấp độ tổ chức cho các nhà giao dịch nhắm mục tiêu các mức giá chính và đảo chiều trong ngày.
TÍNH NĂNG
Năm Phương Pháp Tính Toán
- Chuẩn: Công thức truyền thống của nhà giao dịch sàn—các pivot được theo dõi rộng rãi nhất trên toàn cầu
- Fibonacci: Sử dụng tỷ lệ Fib (38.2%, 61.8%, 100%, 138.2%, 161.8%) cho khoảng cách S/R
- Woodie: Trọng số cao cho giá đóng cửa—phản ứng nhanh hơn với hành động giá gần đây
- Camarilla: Các mức trong ngày chặt chẽ sử dụng hệ số nhân 1.1/12—phổ biến cho scalping
- DeMark: Công thức điều kiện dựa trên mối quan hệ đóng cửa so với mở cửa—chỉ có 1 mức S/R nhưng rất được tôn trọng
Tùy Chỉnh Toàn Diện
- Bất kỳ khung thời gian nào: Tính toán từ dữ liệu M5, H1, H4, Hàng ngày, Hàng tuần, Hàng tháng
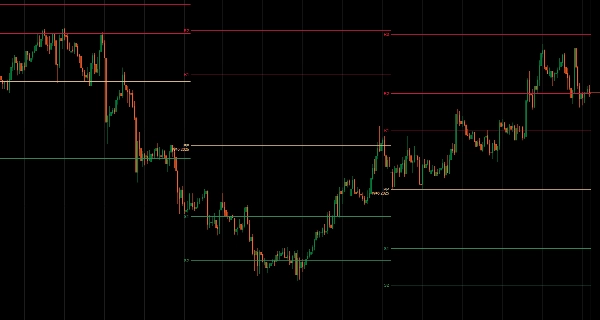
- Pivot lịch sử: Hiển thị lên đến nhiều kỳ trước (ví dụ: 3 tuần pivot gần nhất)
- Mức có thể cấu hình: Hiển thị 0-6 mức hỗ trợ/kháng cự mỗi bên
- Đường được gán nhãn tự động: PP, R1-R6, S1-S6 được đánh dấu rõ ràng
- Đường giới hạn thời gian: Pivot của mỗi kỳ chỉ hiển thị trong khoảng thời gian của kỳ đó
- Mã màu: Pivot (màu nâu nhạt), Kháng cự (màu đỏ), Hỗ trợ (màu xanh lá)
__________________________________________________________________________________________
NHIỀU CHỈ BÁO MIỄN PHÍ HƠN
Khám phá nhiều công cụ phân tích thị trường—từ cấu trúc và khối lượng đến hồi quy, biến động và các khung thời gian tùy chỉnh.
Mã nguồn có sẵn trên kho lưu trữ GitHub.
Tất cả đều miễn phí sử dụng. Nhưng nếu bạn muốn hỗ trợ bằng cách gửi cà phê, bạn có thể gửi tại đây.
Hỗ Trợ/Kháng Cự
Khối Lượng
- Volume Activity Profiler
- Volume Efficiency Analyzer
- Volume Profile Analytics
- Volume Profile - Updated
- Volume Spread Analysis
- VWAP (Giá Trung Bình Trọng Số Khối Lượng)
Đường Trung Bình Động
- Kênh SSL
- Đường Trung Bình Động Neo
- Đường Trung Bình Động Tỷ Lệ Độ Lệch
- Bộ Kích Hoạt Gann Cao Thấp
- Đường Xu Hướng Tức Thì
- Đường Trung Bình Động Adaptive Kaufman với Tầm Nhìn Xu Hướng
- Kênh Đường Trung Bình Động
- Bộ Đường Trung Bình Động
- Đường Trung Bình Động Kênh Xu Hướng
Tiện Ích/Tùy Chỉnh
Dựa Trên Hồi Quy
Biến Động
Bộ Dao Động
__________________________________________________________________________________________
TỪ CHỐI TRÁCH NHIỆM
Giao dịch có rủi ro. Chỉ báo này chỉ dành cho phân tích kỹ thuật — luôn áp dụng quản lý rủi ro phù hợp và giao dịch có trách nhiệm.
PHẢN HỒI & CẢI TIẾN
Nếu bạn có đề xuất, yêu cầu tính năng hoặc ý tưởng cải tiến, vui lòng để lại bình luận trong tab Thảo luận. Phản hồi của bạn giúp cải thiện chỉ báo cho mọi người.
Tóm tắt
Đánh giá của khách hàng
5 | 100 % | |
4 | 0 % | |
3 | 0 % | |
2 | 0 % | |
1 | 0 % |


![Logo "[Stellar Strategies] Market Session Ultimate"](https://cdn.ctrader.com/image/webp/61ffd537-0125-4246-9e72-42eca1791d64_28232)