Mô tả
GHI CHÚ QUAN TRỌNG - ĐỌC TRƯỚC
Khối lượng Forex không phải là khối lượng thực
Khối lượng trong forex là khối lượng tick — nó đếm số lần giá thay đổi. Nó KHÔNG đếm số tiền đã giao dịch.
Những gì khối lượng tick không thể hiển thị
- Kích thước giao dịch. Một giao dịch 100 đô la và một giao dịch 10.000.000 đô la đều được tính là 1 tick.
- Dòng tiền thực. Bạn không thể thấy liệu tiền lớn hay tiền nhỏ đã di chuyển giá.
- Thanh khoản thực sự. Bạn không thể thấy có bao nhiêu lệnh đang chờ trong thị trường.
- Hoạt động của ngân hàng. Ngân hàng thấy dữ liệu khối lượng thực. Bạn thì không.
Điều này có nghĩa là gì
Khối lượng tick chỉ cho thấy tần suất giá thay đổi — không phải số tiền đằng sau nó. Điều này tạo ra các vấn đề:
- Bạn không thể theo dõi các ngân hàng hoặc tổ chức. Họ sử dụng dữ liệu khối lượng thực mà bạn không có quyền truy cập.
- Bạn không thể chứng minh các lý thuyết "tiền thông minh". Những ý tưởng đó cần khối lượng thực, không phải số đếm tick.
- Bạn không thể đánh giá thanh khoản thực sự. Hoạt động tick không cho thấy độ sâu lệnh hoặc sức mạnh thị trường thực.
- Bạn không thể đo lường sức mua hoặc bán thực sự. Nhiều giao dịch nhỏ trông giống như một giao dịch lớn của tổ chức.
- Các đỉnh khối lượng có thể gây hiểu lầm. Một đỉnh có thể chỉ là nhiễu thuật toán, không phải sự quan tâm giao dịch thực sự.
Cách sử dụng chỉ báo này đúng cách
- Xem nó như một đồng hồ đo hoạt động, không phải đồng hồ đo tiền. Khối lượng tick cao = thị trường bận rộn. Khối lượng tick thấp = thị trường yên tĩnh. Không hơn thế nữa.
- So sánh hoạt động giữa các thời điểm khác nhau. Dùng nó để xem: Phiên London có bận rộn hơn New York không? Hôm nay có hoạt động hơn hôm qua không? Giai đoạn xu hướng có bận rộn hơn giai đoạn tích lũy không?
- Kết hợp với cấu trúc giá. Sử dụng hỗ trợ/kháng cự, điểm swing, hoặc BOS/ChoCH cùng với khối lượng. Bối cảnh giá giúp tránh tín hiệu sai từ các đỉnh khối lượng ồn ào.
- Theo dõi hoạt động tại các mức giá quan trọng. Khi giá kiểm tra một mức quan trọng và khối lượng tick tăng, điều đó có nghĩa là nhiều nhà giao dịch đang hoạt động. Nó KHÔNG có nghĩa là các nhà đầu tư lớn tham gia.
- Không nên cho rằng nó thể hiện hoạt động của tổ chức. Khối lượng tick không thể hiển thị tích lũy, các lệnh lớn, hoặc "tiền thông minh". Chỉ dùng nó để đo nhịp độ và tốc độ.
__________________________________________________________________________________________
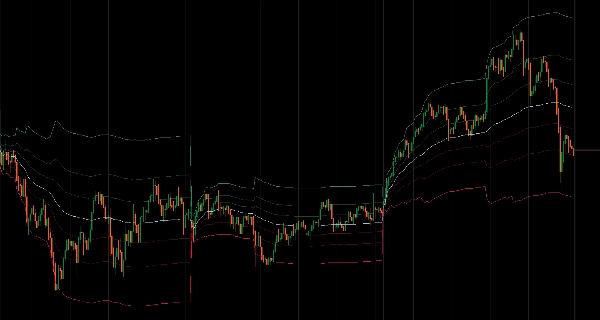
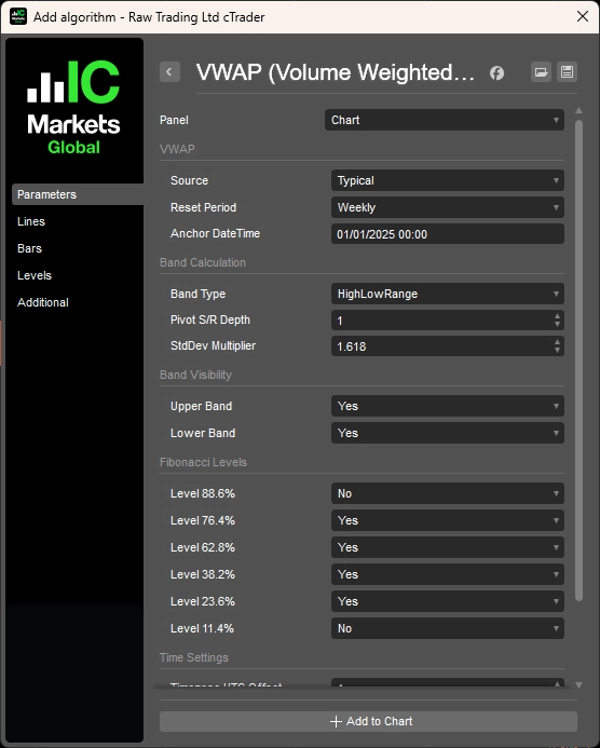
Giá trung bình trọng số theo khối lượng với các khoảng thời gian đặt lại linh hoạt và ba phương pháp tính toán dải băng.
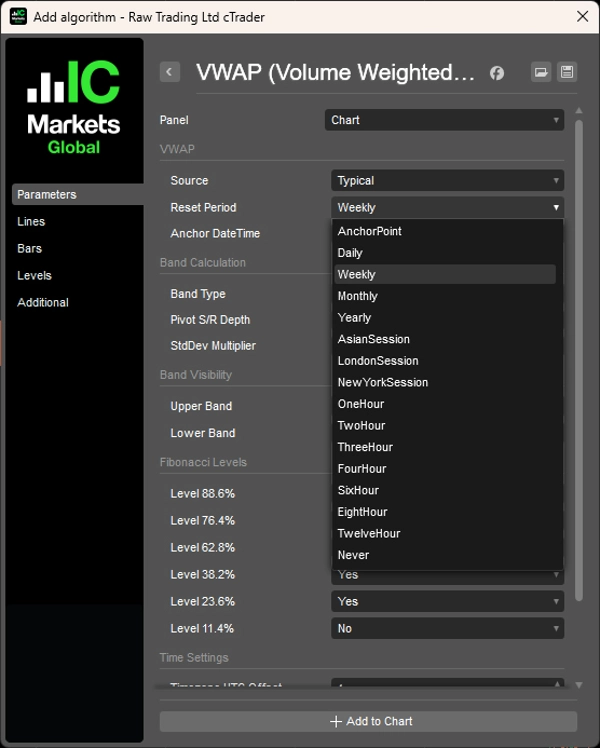
Tính Giá Trung Bình Trọng Số Khối Lượng với các khoảng thời gian đặt lại linh hoạt bao gồm các khoảng thời gian dựa trên thời gian (hàng ngày, hàng tuần, hàng tháng, hàng năm hoặc theo giờ tùy chỉnh), đặt lại theo phiên (phiên Châu Á, London, New York với thời gian bắt đầu có thể cấu hình), chế độ điểm neo để ghim VWAP vào các sự kiện cụ thể, hoặc tính toán lăn từ tất cả dữ liệu có sẵn.
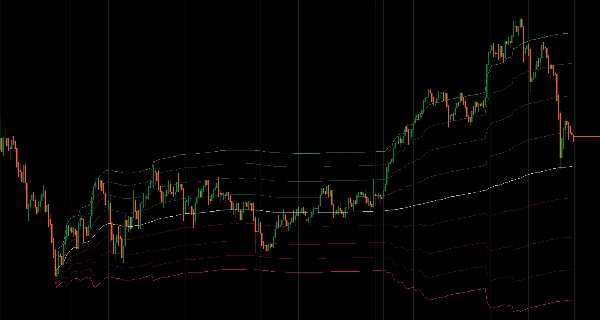
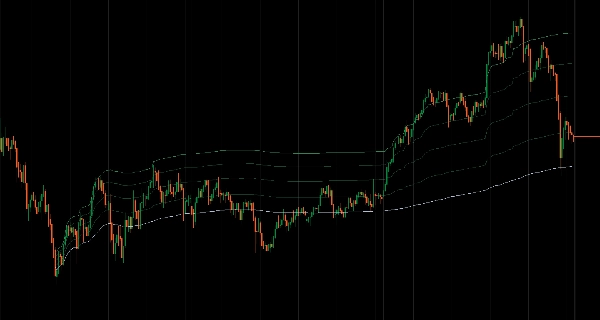
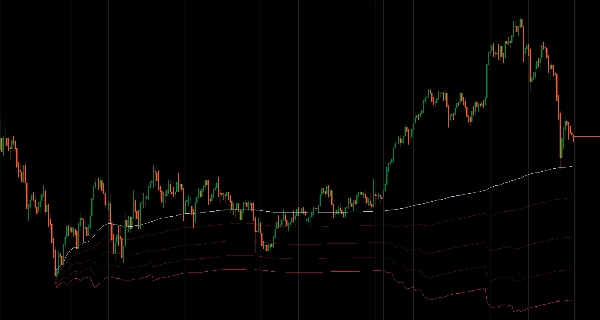
Nó cung cấp ba phương pháp tính toán dải băng: Dải Cao/Thấp dựa trên phạm vi giá của kỳ trước, Fibonacci Pivot sử dụng tính toán điểm xoay cổ điển, và dải Độ lệch Chuẩn mở rộng và co lại theo biến động.
Bạn có thể tùy chỉnh tám mức Fibonacci (100%, 88.6%, 76.4%, 62.8%, 50%, 38.2%, 23.6%, 11.4%, 0%) với các nút bật tắt hiển thị riêng biệt và điều khiển nhóm dải trên/dưới nhanh. Quản lý phiên bao gồm cấu hình thời gian bắt đầu chính xác với điều chỉnh bù UTC và xử lý đặt lại theo giờ có nhận biết múi giờ.
TÍNH NĂNG
- Khoảng thời gian đặt lại linh hoạt
-
- Dựa trên thời gian: Hàng ngày, hàng tuần, hàng tháng, hàng năm hoặc các khoảng thời gian theo giờ tùy chỉnh (1H, 2H, 3H, 4H, 6H, 8H, 12H)
- Dựa trên phiên: Phiên Châu Á, London, New York với thời gian bắt đầu và bù múi giờ có thể cấu hình
- Điểm neo: Ghim VWAP vào bất kỳ ngày giờ cụ thể nào để phân tích theo sự kiện
- Tính lăn: Tính từ tất cả dữ liệu có sẵn mà không đặt lại
- Ba phương pháp tính toán dải băng
-
- Dải Cao/Thấp: Dải dựa trên phạm vi giá của kỳ trước
- Fibonacci Pivot: Tính điểm xoay cổ điển từ H/L/C của kỳ trước
- Độ lệch chuẩn: Dải thống kê truyền thống mở rộng/thu hẹp theo biến động
- Kiểm soát mức Fibonacci hoàn chỉnh
-
- 8 mức có thể tùy chỉnh: 100%, 88.6%, 76.4%, 62.8%, 50% (VWAP), 38.2%, 23.6%, 11.4%, 0%
- Nút bật tắt hiển thị từng mức riêng biệt
- Điều khiển nhóm dải trên/dưới để điều chỉnh nhanh
- Quản lý phiên
-
- Cấu hình thời gian bắt đầu phiên chính xác với điều chỉnh bù UTC (-12 đến +14 giờ)
- Hiển thị thông tin phiên trực quan cho lịch trình đặt lại hiện tại
- Xử lý đặt lại theo giờ có nhận biết múi giờ
- Tối ưu hiệu suất
-
- Tính toán lười biếng — dải băng chỉ được tính khi hiển thị
- Bộ nhớ đệm thông minh và xử lý theo lô
- Tác động CPU tối thiểu ngay cả khi bật tất cả các mức
__________________________________________________________________________________________
NHIỀU CHỈ BÁO MIỄN PHÍ HƠN
Khám phá nhiều công cụ phân tích thị trường — từ cấu trúc và khối lượng đến hồi quy, biến động và khung thời gian tùy chỉnh.
Mã nguồn có sẵn trên kho GitHub.
Tất cả đều miễn phí sử dụng. Nhưng nếu bạn muốn gửi hỗ trợ cà phê, bạn có thể chuyển đến đây.
Hỗ trợ/Kháng cự
Khối lượng
- Bộ phân tích hoạt động khối lượng
- Phân tích hiệu quả khối lượng
- Phân tích hồ sơ khối lượng
- Hồ sơ khối lượng - Cập nhật
- Phân tích phân bổ khối lượng
- VWAP (Giá trung bình trọng số theo khối lượng)
Đường trung bình động
- Kênh SSL
- Đường trung bình động neo
- Đường trung bình động tỷ lệ lệch
- Bộ kích hoạt Gann Cao Thấp
- Đường xu hướng tức thời
- Đường trung bình động thích ứng Kaufman với Trend Vision
- Kênh đường trung bình động
- Bộ đường trung bình động
- Đường trung bình động kênh xu hướng
Tiện ích/Tùy chỉnh
Dựa trên hồi quy
Biến động
Bộ dao động
__________________________________________________________________________________________
TỪ CHỐI TRÁCH NHIỆM
Giao dịch có rủi ro. Chỉ báo này chỉ dành cho phân tích kỹ thuật — luôn áp dụng quản lý rủi ro phù hợp và giao dịch có trách nhiệm.
PHẢN HỒI & CẢI TIẾN
Nếu bạn có đề xuất, yêu cầu tính năng hoặc ý tưởng cải tiến, vui lòng để lại bình luận trong tab Thảo luận. Phản hồi của bạn giúp cải thiện chỉ báo cho mọi người.
Tóm tắt
The indicator offers three band calculation methods: High/Low Range bands based on the previous period's price range, Fibonacci Pivot bands using classical pivot calculations, and Standard Deviation bands that adjust with market volatility. Users can customize eight Fibonacci levels (ranging from 0% to 100%) with individual visibility toggles and group controls for upper and lower bands.
Session management features include precise start time configuration with UTC offset adjustments and timezone-aware hourly resets, along with visual session information display. Performance optimizations include lazy calculation of bands only when visible, intelligent caching, and batch processing to minimize CPU usage.
Note: For forex markets, volume data represents tick volume (price change counts) rather than actual traded volume, so this indicator should be used as a measure of market activity rather than real money flow. It is intended for technical analysis with proper risk management.
Đánh giá của khách hàng
5 | 100 % | |
4 | 0 % | |
3 | 0 % | |
2 | 0 % | |
1 | 0 % |