
Mô tả
TỔNG QUAN
Phân tích Phân bố Khối lượng (VSA) là một phương pháp được phát triển bởi Tom Williams, một nhà giao dịch syndicate trước đây, dựa trên công trình của Richard Wyckoff từ đầu những năm 1900. VSA giải thích mối quan hệ giữa khối lượng, biên độ giá (khoảng cách), và vị trí đóng cửa để xác định sự mất cân bằng cung cầu.
Các Khái niệm Chính của VSA:
- Khối lượng cho thấy mức độ hoạt động - ai đang tham gia
- Biên độ cho thấy sự biến động và không chắc chắn - giá đã di chuyển bao xa
- Vị trí Đóng cửa cho thấy bên nào thắng trong thanh nến - người mua hay người bán
- Ngữ cảnh cho thấy vị trí của chúng ta trong chu kỳ thị trường - giai đoạn mạnh hay yếu
Khi khối lượng tăng với biên độ rộng nhưng tiến triển giá ít, điều này gợi ý sự hấp thụ (một bên đang hấp thụ áp lực của bên kia). Khi khối lượng giảm với biên độ hẹp trong một xu hướng, điều này gợi ý sự thiếu tham gia (có thể là yếu).
Triển khai này:
Chỉ báo này định lượng các khái niệm VSA bằng các phương pháp thống kê. Nó khác với VSA truyền thống ở một số điểm:
- Sử dụng
(close - open) / rangelàm chỉ số hiệu quả (không có trong VSA gốc) - Các mẫu hấp thụ xác định "một bên thắng" thay vì "hấp thụ áp lực" truyền thống
- ENR (Nỗ lực Không Kết quả) được định lượng bằng ngưỡng hiệu quả; VSA gốc mang tính diễn giải hơn
- Sử dụng trung bình cắt tỉa cho trung bình khối lượng (chống ngoại lệ) và xếp hạng phần trăm cho biên độ
- Không bao gồm: Khối lượng Dừng, Upthrust, Test, các mẫu Shakeout
Đây là một phương pháp định lượng, thuật toán cho các khái niệm VSA. VSA truyền thống mang tính diễn giải và phụ thuộc vào ngữ cảnh nhiều hơn. Hãy sử dụng chỉ báo này như một công cụ phân tích trong nhiều công cụ, không phải là tín hiệu độc lập.
CHỨC NĂNG CỦA CHỈ BÁO NÀY
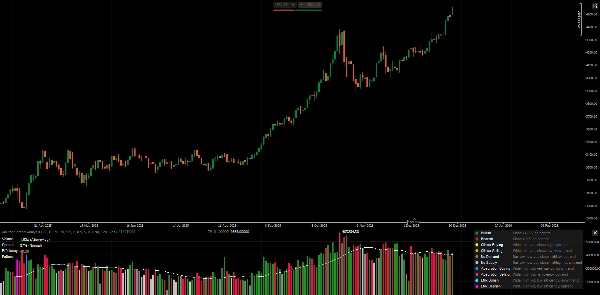
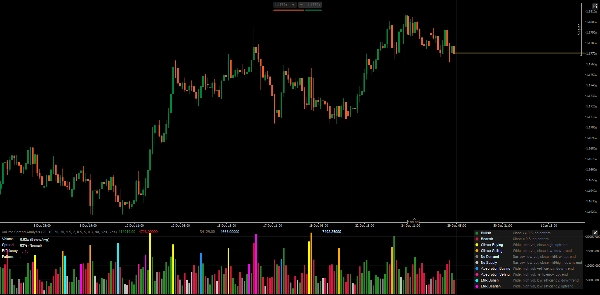
Phân tích khối lượng, biên độ và vị trí đóng cửa của từng thanh để phát hiện các mất cân bằng cung/cầu tiềm năng. Hiển thị biểu đồ khối lượng được tô màu theo loại mẫu, kèm bảng chỉ số thời gian thực.
ĐỊNH NGHĨA MẪU
1. Thanh Tiêu Chuẩn (Không Có Mẫu)
- Tăng Giá: Đóng cửa ≥ 0.5 trong biên độ, không phát hiện mẫu đặc biệt
- Giảm Giá: Đóng cửa < 0.5 trong biên độ, không phát hiện mẫu đặc biệt
2. Mẫu Climax (Tiềm năng Cạn Kiệt)
- Mua Climax: Biên độ rộng + khối lượng cực cao + đóng cửa cao + trong xu hướng tăng
-
- Diễn giải: Có thể là sự cạn kiệt mua, chú ý đảo chiều
- Bán Climax: Biên độ rộng + khối lượng cực cao + đóng cửa thấp + trong xu hướng giảm
-
- Diễn giải: Có thể là sự cạn kiệt bán, chú ý đảo chiều
3. Mẫu Yếu (Thiếu Quyết đoán)
- Không Có Nhu Cầu: Biên độ hẹp + khối lượng thấp + đóng cửa giữa/thấp + trong xu hướng tăng
-
- Diễn giải: Người mua không hỗ trợ đà tăng, có thể yếu
- Không Có Cung: Biên độ hẹp + khối lượng thấp + đóng cửa giữa/cao + trong xu hướng giảm
-
- Diễn giải: Người bán không đẩy giá xuống, có thể mạnh
4. Mẫu Hấp Thụ (Một Bên Thắng)
- Hấp Thụ Mua: Biên độ rộng + khối lượng cao + hiệu quả dương + trong xu hướng giảm
-
- Diễn giải: Người mua hấp thụ áp lực bán, có thể đảo chiều tăng
- Hấp Thụ Bán: Biên độ rộng + khối lượng cao + hiệu quả âm + trong xu hướng tăng
-
- Diễn giải: Người bán hấp thụ áp lực mua, có thể đảo chiều giảm
5. Mẫu ENR (Nỗ Lực Không Có Kết Quả Rõ Ràng)
- ENR Tăng Giá: Biên độ rộng + khối lượng cao + hiệu quả thấp + trong xu hướng giảm
-
- Diễn giải: Nỗ lực cao nhưng không có bên thắng rõ ràng, có thể hỗ trợ/đắn đo
- ENR Giảm Giá: Biên độ rộng + khối lượng cao + hiệu quả thấp + trong xu hướng tăng
-
- Diễn giải: Nỗ lực cao nhưng không có bên thắng rõ ràng, có thể kháng cự/đắn đo
GIẢI THÍCH BẢNG CHỈ SỐ
Khối lượng
- Hiển thị khối lượng thanh hiện tại dưới dạng tỷ lệ so với trung bình cắt tỉa (ví dụ, "1.85x")
- Phân loại: Thấp / Dưới Trung Bình / Trên Trung Bình / Cao / Cực Cao
- Khối lượng cao = sự tham gia thị trường, nhưng ngữ cảnh quan trọng
Biên độ
- Hiển thị thứ hạng phần trăm (0-100%) so với các thanh gần đây
- Phân loại: Hẹp / Bình Thường / Rộng
- Biên độ rộng = biến động/không chắc chắn, không nhất thiết là hướng đi
Hiệu quả
- Công thức:
(close - open) / (high - low) - Phạm vi: -1.0 đến +1.0
- Dương = thân tăng chiếm ưu thế trong biên độ
- Âm = thân giảm chiếm ưu thế trong biên độ
- Gần bằng không = thân nhỏ, bóng dài, do dự
Mẫu
- Mẫu hiện tại được phát hiện (hoặc "-" nếu không có)
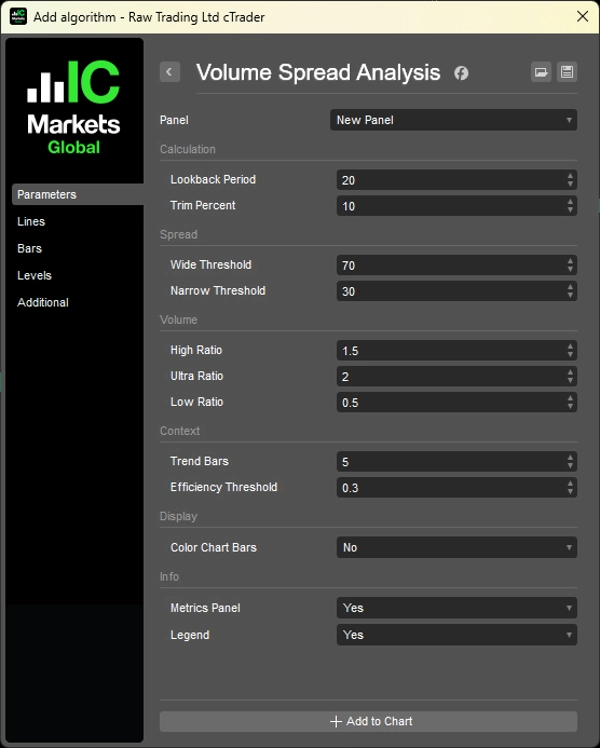
THAM SỐ
1. Tính Toán
- Khoảng Thời Gian Quay Lại (20): Số thanh dùng để thống kê khối lượng/biên độ
- Tỉ lệ Cắt Tỉa (10%): Loại bỏ ngoại lệ trong tính toán khối lượng
2. Phân Loại Biên Độ
- Ngưỡng Rộng (70%): Phần trăm để phân loại là "rộng"
- Ngưỡng Hẹp (30%): Phần trăm để phân loại là "hẹp"
3. Phân Loại Khối Lượng
- Tỉ lệ Cao (1.5x): Ngưỡng trên trung bình
- Tỉ lệ Cực Cao (2.0x): Ngưỡng cực cao
- Tỉ lệ Thấp (0.5x): Ngưỡng dưới trung bình
4. Ngữ Cảnh
- Thanh Xu Hướng (5): Số thanh lùi lại để so sánh hướng xu hướng
- Ngưỡng Hiệu Quả (0.3): Mức tối thiểu cho hiệu quả "mạnh"
5. Hiển Thị
- Tô Màu Thanh Biểu Đồ: Áp dụng màu mẫu lên biểu đồ giá
- Bảng Chỉ Số: Hiển thị chỉ số thời gian thực
- Chú Giải: Hiển thị hướng dẫn tham khảo mẫu
CÁCH SỬ DỤNG
1. Không sử dụng mẫu làm tín hiệu giao dịch trực tiếp - chúng chỉ chỉ ra ngữ cảnh tiềm năng, không phải điểm vào lệnh.
2. Kết hợp với cấu trúc giá - VSA hoạt động tốt nhất khi xác nhận những gì cấu trúc giá thể hiện.
3. Chú ý đến ngữ cảnh - cùng một mẫu có thể mang ý nghĩa khác nhau tại hỗ trợ so với kháng cự.
4. Góc nhìn về khối lượng quan trọng - hấp thụ khối lượng cao tại mức quan trọng > hấp thụ thanh ngẫu nhiên.
Hạn Chế Khối Lượng Forex
Thị trường forex giao ngay hiển thị khối lượng tick (số lần thay đổi giá), không phải hợp đồng giao dịch thực tế. Các mẫu có thể kém tin cậy hơn so với thị trường tương lai/cổ phiếu có dữ liệu khối lượng thực.
CHÚ GIẢI (Tham Khảo Tích Hợp)
Bật tham số "Chú Giải" để hiển thị mô tả mẫu trực tiếp trên biểu đồ.
__________________________________________________________________________________________
NHIỀU CHỈ BÁO MIỄN PHÍ KHÁC
Khám phá nhiều công cụ phân tích thị trường—từ cấu trúc và khối lượng đến hồi quy, biến động và khung thời gian tùy chỉnh.
Mã nguồn có sẵn trên kho lưu trữ GitHub repository.
Tất cả đều miễn phí sử dụng. Nhưng nếu bạn muốn gửi hỗ trợ cà phê, bạn có thể chuyển đến đây.
Hỗ Trợ/Kháng Cự
Khối Lượng
- Volume Activity Profiler
- Volume Efficiency Analyzer
- Volume Profile Analytics
- Volume Profile - Updated
- Volume Spread Analysis
- VWAP (Volume Weighted Average Price)
Đường Trung Bình Động
- SSL Channel
- Anchored Moving Average
- Deviation-Scaled Moving Average
- Gann High Low Activator
- Instantaneous Trendline
- Kaufman Adaptive MA with Trend Vision
- Moving Average Channel
- Moving Averages Suite
- Trend Channel Moving Average
Tiện Ích/Tùy Chỉnh
Dựa trên Hồi Quy
Biến Động
Bộ Dao Động
__________________________________________________________________________________________
TỪ CHỐI TRÁCH NHIỆM
Giao dịch có rủi ro. Chỉ báo này chỉ dành cho phân tích kỹ thuật — luôn áp dụng quản lý rủi ro phù hợp và giao dịch có trách nhiệm.
PHẢN HỒI & CẢI TIẾN
Nếu bạn có đề xuất, yêu cầu tính năng hoặc ý tưởng cải tiến, vui lòng để lại bình luận trong tab Thảo luận. Phản hồi của bạn giúp cải thiện chỉ báo cho mọi người.
Tóm tắt
This implementation quantifies VSA concepts using statistical methods, including an efficiency metric defined as (close - open) / range, trimmed mean volume averaging, and percentile ranking for spread. It identifies several bar patterns: Standard (bullish/bearish), Climax (buying/selling exhaustion), Weak (No Demand/No Supply), Absorption (one side winning), and ENR (Effort No Result), each indicating different market conditions.
The indicator displays a volume histogram colored by detected pattern type and provides a real-time metrics panel showing volume ratio, spread percentile, efficiency, and current pattern. Parameters allow customization of lookback periods, volume/spread thresholds, and display options such as coloring chart bars and showing a pattern legend.
VSA is applicable across markets including Forex, stocks, indices, commodities, and crypto. Note that Forex volume reflects tick volume, which may affect pattern reliability. The indicator is designed as an analytical tool to complement price structure analysis rather than as standalone trade signals.
Đánh giá của khách hàng
5 | 100 % | |
4 | 0 % | |
3 | 0 % | |
2 | 0 % | |
1 | 0 % |


