
AutoLines™ Support & Resistance
Chỉ báo
2 lượt mua
Phiên bản 1.0, May 2025
Windows, Mac
4.5
Đánh giá: 4
Mô tả
FlexSR là chỉ báo Hỗ trợ & Kháng cự chuyên nghiệp, tất cả trong một dành cho cTrader của bạn. Nó tự động xác định các điểm cao và thấp xoay vòng trong khoảng thời gian bạn chọn, vẽ lên đến N mức gần đây nhất, và kéo dài chúng trên toàn bộ biểu đồ. Với màu sắc, kiểu đường, độ dày có thể tùy chỉnh hoàn toàn, cùng các nhãn ngày-giá tùy chọn, FlexSR cung cấp cho bạn các vùng rõ ràng nơi giá có khả năng dừng lại, đảo chiều hoặc bứt phá—giúp bạn giao dịch với sự tự tin.
Tính năng chính
Tóm tắt
Tóm tắt AI
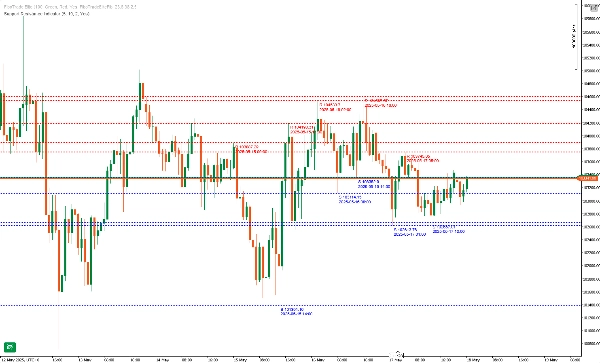
AutoLines™ Support & Resistance (FlexSR) is a professional indicator for cTrader that automatically detects pivot highs and lows over a user-defined lookback period. It plots up to N of the most recent support and resistance levels and extends these lines across the chart for continuous visibility. The indicator features customizable colors, line styles, thickness (1–5 px), and optional date-price labels for clear identification of key zones where price may stall, reverse, or break out.
Key functionalities include:
- Automatic pivot detection scanning each bar for true swing highs and lows.
- Dynamic management of displayed levels, showing only the user-set maximum number of lines to maintain chart clarity.
- Non-interactive, lockable lines that redraw automatically to prevent accidental changes.
- Real-time updates on every tick, ensuring levels remain current even in fast markets.
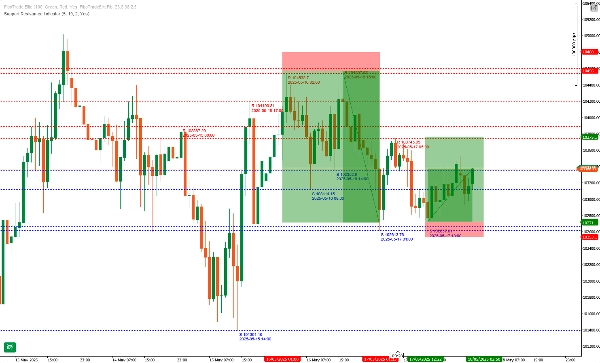
FlexSR supports intuitive trade management by visually highlighting confluence zones and providing clear support and resistance references. It is designed for ease of use with sensible default settings and minimal configuration. The indicator aids traders in identifying potential reversal and breakout points, supporting various trading strategies with precise and reliable level plotting.
Key functionalities include:
- Automatic pivot detection scanning each bar for true swing highs and lows.
- Dynamic management of displayed levels, showing only the user-set maximum number of lines to maintain chart clarity.
- Non-interactive, lockable lines that redraw automatically to prevent accidental changes.
- Real-time updates on every tick, ensuring levels remain current even in fast markets.
FlexSR supports intuitive trade management by visually highlighting confluence zones and providing clear support and resistance references. It is designed for ease of use with sensible default settings and minimal configuration. The indicator aids traders in identifying potential reversal and breakout points, supporting various trading strategies with precise and reliable level plotting.
Hồ sơ chỉ báo
Đánh giá của khách hàng
4.5
Đánh giá: 4
5 | 50 % | |
4 | 50 % | |
3 | 0 % | |
2 | 0 % | |
1 | 0 % |
Đánh giá của khách hàng
November 9, 2025
AutoLines™ S&R does the heavy lifting - clear, dynamic levels that adapt to price action. Perfect for traders who love clean charts and structure. Missing alerts, but performance and accuracy make it a must-have for support/resistance setups.
May 30, 2025
May 28, 2025
May 24, 2025
messy signals are easier to question, but overconfidence is the real danger.
Thảo luận
Câu hỏi thường gặp
Breakout
Các sản phẩm có sẵn trên cTrader Store, bao gồm bot giao dịch, chỉ báo và plugin, được cung cấp bởi các nhà phát triển bên thứ ba và chỉ nhằm mục đích cung cấp thông tin và tiếp cận kỹ thuật. cTrader Store không phải là nhà môi giới và không cung cấp lời khuyên đầu tư, khuyến nghị cá nhân hay bất kỳ đảm bảo nào về hiệu suất trong tương lai.


![Logo "[Stellar Strategies] Market Session Ultimate"](https://cdn.ctrader.com/image/webp/61ffd537-0125-4246-9e72-42eca1791d64_28232)


Giá
Kể từ 22/11/2024
133
Lượt bán
2.58K
Cài đặt miễn phí