
说明
通过专为cTrader平台设计的综合相对货币强度(RCS)指标,深入了解外汇市场动态。
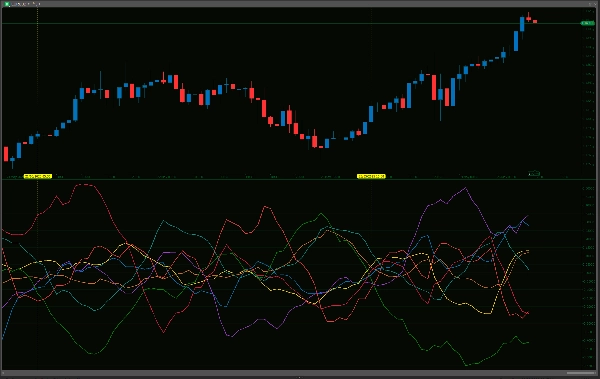
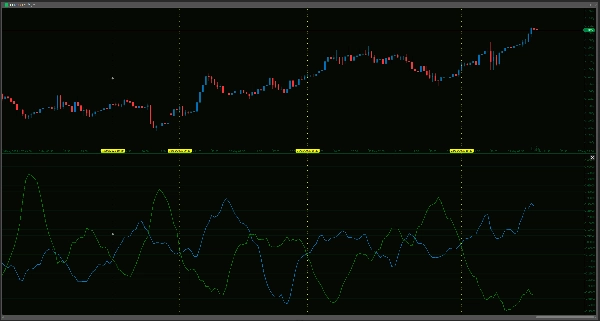
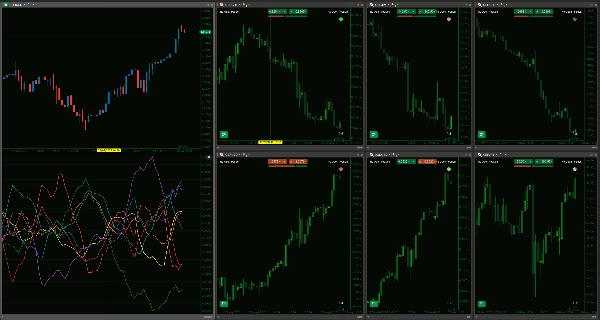
这个强大的工具通过分析28个货币对中八种主要货币——AUD、USD、EUR、JPY、GBP、CAD、CHF和NZD——相互之间的百分比变化,细致评估它们的个别表现。通过用户定义的回溯和平滑周期,您可以微调指标的灵敏度,以符合您独特的交易方法,从快速剥头皮到长期策略。清晰的视觉输出允许即时一目了然的比较,帮助您快速识别表现出强劲上升势头或显示疲软迹象的货币,这对于选择具有更高潜力的货币对策略非常有帮助。它提供了一种超越单一货币对分析的方法,帮助您看到真正推动市场走势的个别货币的全貌。
然而,关键是要在清楚了解其功能和局限性的前提下使用此指标。RCS指标是一个复杂的分析工具,而非万无一失的预测装置或完整的“设定后忘记”交易系统。其计算基于历史价格数据,旨在补充而非替代您既定的交易方法,该方法应始终包括全面的价格行为分析、基本面因素的考虑以及稳健的风险管理实践。虽然线条突出显示了“强势”或“弱势”,但这些读数需要在更广泛的市场背景下谨慎解读;例如,显示极端“强势”的货币可能正接近超买状态或关键阻力位。
该指标的表现也可能随当前市场状况波动(例如,在强趋势市场与横盘震荡市场中的表现可能不同),其准确性依赖于您的平台拥有所有28个货币对的充足且干净的历史数据。虽然针对持续计算进行了优化,但如此全面的跨货币分析的初始数据加载可能对平台资源要求较高,尤其是在连接较慢或硬件性能较弱的情况下。通过提供细致的多货币视角,该RCS指标作为有价值的辅助工具,帮助您做出更明智、策略上合理的交易决策,并有可能提升您在竞争激烈的外汇市场中的优势,而非作为独立解决方案。
请确认您的经纪商提供此指标所涉及的所有交叉货币对,以确保其正常工作。
--------------------------
欢迎查看我的其他指标!
https://ctrader.com/products/1181
https://ctrader.com/products/1182
https://ctrader.com/products/1180
https://ctrader.com/products/1015
https://ctrader.com/products/555
https://ctrader.com/products/553
https://ctrader.com/products/554
https://ctrader.com/products/552
https://ctrader.com/products/557
https://ctrader.com/products/845
https://ctrader.com/products/848
https://ctrader.com/products/847
https://ctrader.com/products/846
https://ctrader.com/products/551
https://ctrader.com/products/574
https://ctrader.com/products/573
https://ctrader.com/products/556
https://ctrader.com/products/558
https://ctrader.com/products/559
https://ctrader.com/products/560
摘要
The indicator provides a clear visual representation of currency strength and weakness, enabling traders to identify currencies with strong momentum or signs of weakness at a glance. This multi-currency perspective helps move beyond single-pair analysis to understand which currencies are driving market movements.
The tool relies on historical price data and requires all relevant currency pairs to be available from the broker. Its performance may vary with market conditions, and it is intended to complement, not replace, comprehensive trading strategies that include price action, fundamental analysis, and risk management. Initial data loading can be resource-intensive due to the breadth of cross-currency calculations.
This indicator serves as an analytical aid to support more informed Forex trading decisions by highlighting relative currency strength across major pairs.
客户评价
5 | 33 % | |
4 | 67 % | |
3 | 0 % | |
2 | 0 % | |
1 | 0 % |


!["[Hamster-Coder] Pivot Points MTF" 标识](https://cdn.ctrader.com/image/webp/4c143e5a-309c-40e3-a578-f04d1e133ffa_31159)


!["[Stellar Strategies] MARSI Signal Plotter" 标识](https://cdn.ctrader.com/image/webp/7b2b8da6-8f8e-4646-8d4a-4710c516c01e_25567)


