
Market Sessions - Free
مؤشر
5.18K التنزيلات
الإصدار 1.0، Feb 2025
Windows, Mac
4.0
التقييمات: 6
الوصف
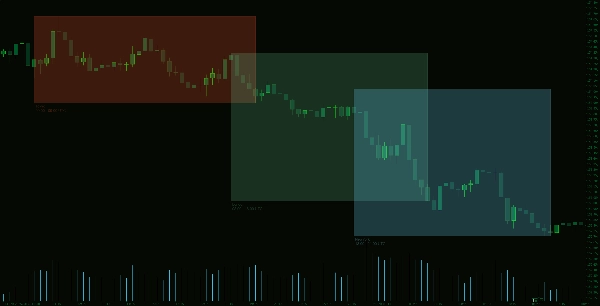
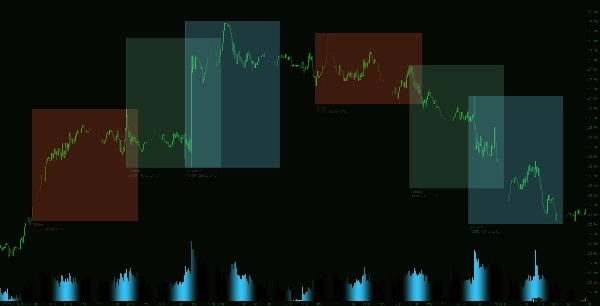
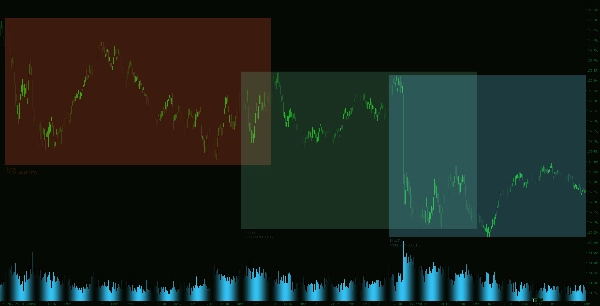
تقديم مؤشر جلسات السوق، أداة قوية للمتداولين لتصور وتتبع جلسات التداول الرئيسية بسهولة على أي مخطط. يبرز هذا المؤشر جلسات التداول في طوكيو ولندن ونيويورك بألوان قابلة للتخصيص، مما يوفر عرضًا بديهيًا لنشاط السوق.
من الاقتراحات الرائعة في التعليقات، تم تحديث هذا المؤشر إلى الإصدار 2: https://ctrader.com/products/1185
الملخص
ملخص الذكاء الاصطناعي
The Market Sessions Indicator is a chart tool designed to visually display the major trading sessions: Tokyo, London, and New York. It highlights these sessions on any chart by drawing rectangles that mark the high and low prices within each session. Users can customize the colors for each session to align with their chart’s theme. The indicator allows selection of session data for up to 10 previous days, providing a flexible historical view. Additionally, the session rectangles can be filled or outlined based on user preference, facilitating quick identification of active market zones. This indicator supports multiple market types including Forex, Indices, Commodities, Crypto, and Stocks.
ملف تعريف المؤشر
تقييمات العملاء
4.0
التقييمات: 6
5 | 50 % | |
4 | 17 % | |
3 | 17 % | |
2 | 17 % | |
1 | 0 % |
تقييمات العملاء
July 9, 2025
Pros: Simple and clear session visualization, customizable colors, low system load, no errors under load. Cons: No transparency adjustment, limited session time customization, lacks alerts and advanced features for professional use.
June 17, 2025
funcional aunque me gustaria editar mas la hora utc que se ve en el grafico
June 3, 2025
very good actually and very accurate ....you need to modify the time to be UTC-4 and UTC-5 as a parameter.
مناقشة
الأسئلة الشائعة
Forex
Indices
Commodities
Crypto
Stocks
يتم توفير المنتجات المتاحة من خلال cTrader Store، بما في ذلك روبوتات التداول والمؤشرات والإضافات، من قبل مطوري الطرف الثالث وإتاحتها لأغراض الوصول المعلوماتي والفني فقط. cTrader Store ليس وسيطًا ولا يقدم نصائح استثمارية أو توصيات شخصية أو أي ضمان للأداء المستقبلي.


السعر
منذ 14/01/2025
55
المبيعات
11.27K
التثبيتات المجانية