MA-RSI HTF Confirmation
指标
380 下载
版本 1.0, Mar 2025
Windows 版、Mac 版
5.0
评价:2
说明
消除虚假信号,自信交易!
什么是MA-RSI HTF确认?
MA-RSI HTF确认是一款高级技术指标,结合了移动平均线、RSI和更高时间框架分析的力量,提供高质量的交易信号。这个复杂的工具专为严肃的交易者设计,帮助过滤市场噪音,只关注最可靠的交易机会。
主要特点:
✅ 双移动平均系统 - 通过快慢MA交叉识别趋势变化
✅ RSI确认 - 通过动量确认验证信号
✅ 更高时间框架验证 - 确保信号与更大市场趋势一致
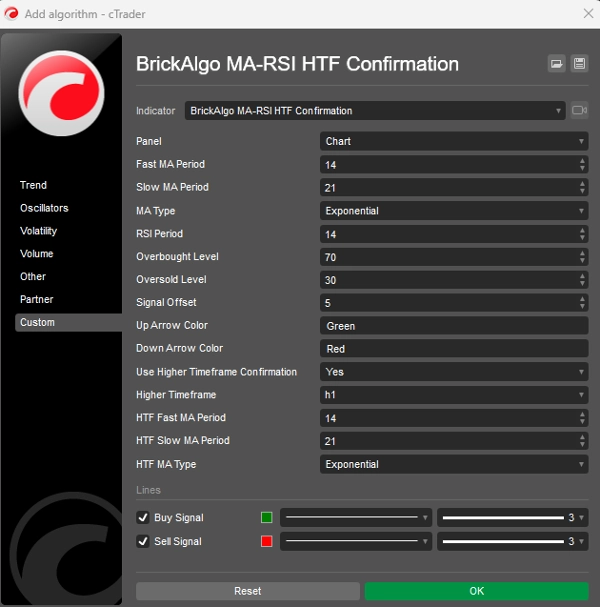
✅ 可定制参数 - 根据您的交易风格和偏好时间框架进行微调
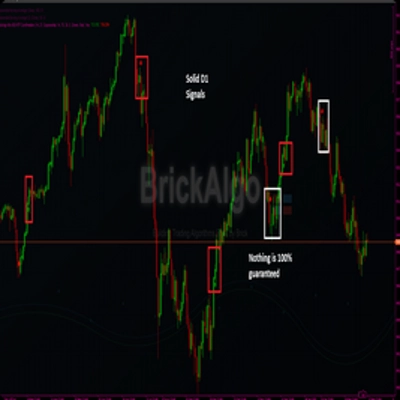
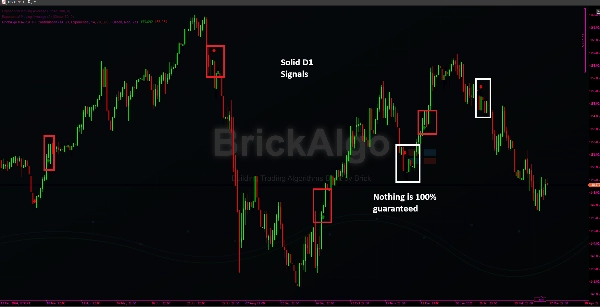
✅ 清晰的视觉信号 - 易于识别的买卖箭头
✅ 简洁的图表界面 - 无杂乱显示,只有可操作的信号
工作原理:
- 指标监控当前时间框架的MA交叉
- 通过RSI读数确认信号强度
- 然后与更高时间框架趋势进行验证
- 只有通过所有三个过滤器的信号才会显示在您的图表上
适用对象:
- 寻找高质量进出场点的波段交易者
- 希望过滤虚假突破的日内交易者
- 寻求入场确认的趋势跟随者
- 厌倦市场噪音干扰的交易者
增强信号过滤:
对于寻求终极信号过滤和趋势识别的交易者,尝试将MA-RSI HTF确认与我们流行的 BrickAlgo TrendPulse 结合使用。这种强大的组合提供无与伦比的交易优势:
- BrickAlgo TrendPulse 识别更广泛的市场方向和强度
- MA-RSI HTF Confirmation 精确定位进出场点
- 两者结合形成一个具有卓越过滤能力的完整交易系统
技术要求:
- 兼容所有cTrader平台
- 适用于所有时间框架和市场
- 安装过程简单
不要盲目交易——让MA-RSI HTF确认以精准和自信引导您的决策!
摘要
指标配置
客户评价
5.0
评价:2
5 | 100 % | |
4 | 0 % | |
3 | 0 % | |
2 | 0 % | |
1 | 0 % |
客户评价
August 18, 2025
Combines MA & RSI with higher timeframe confirmation, customizable, lightweight. Cons: No alerts, no MTF dashboard, no built-in trade zones.
讨论
常见问答
Signal
RSI
cTrader Store 提供的所有产品,包括交易机器人、指标和插件,均由第三方开发者提供,仅供信息参考和技术访问之用。cTrader Store 并非经纪商,不提供投资建议、个人推荐或任何未来业绩保证。


猜您喜欢


!["Smart Money Concepts (SMC) [Iridio Capital]" 标识](https://cdn.ctrader.com/image/webp/28b69fd1-ef54-4bed-9487-07e78e883be4_40934)


价格
注册日期 21/02/2025
466.3M
交易量
180.83K
盈利点数
22
销售
6.91K
免费安装