

说明
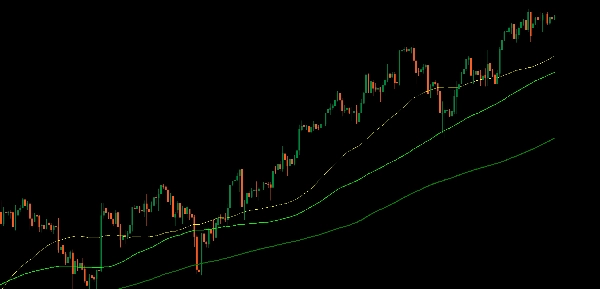
介绍增强版移动平均线指标,旨在为您的交易分析提供更好的定制和灵活性。
此增强版本还支持从更高时间框架的移动平均线到刻度时间框架和Heikin Ashi。Renko和区间周期尚不支持。
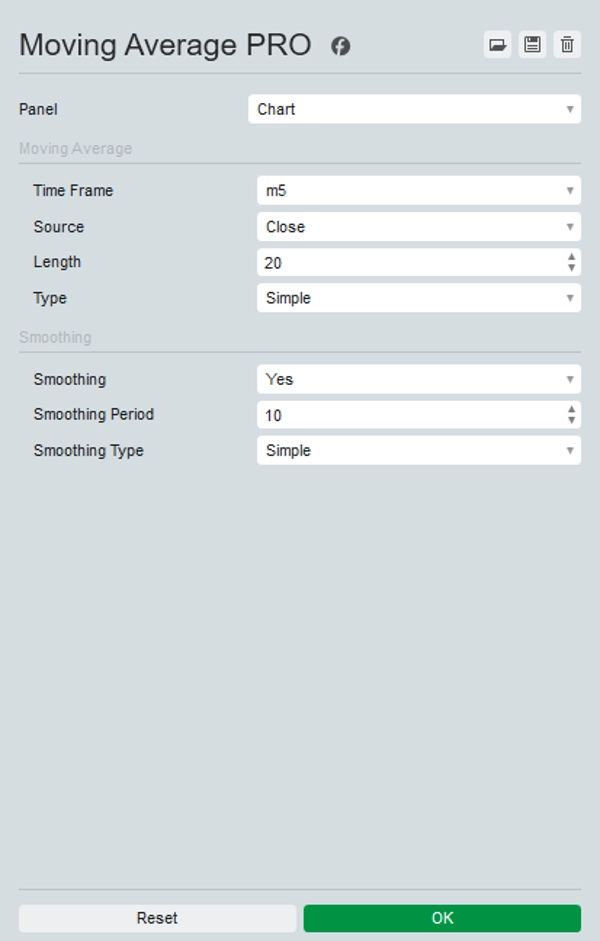
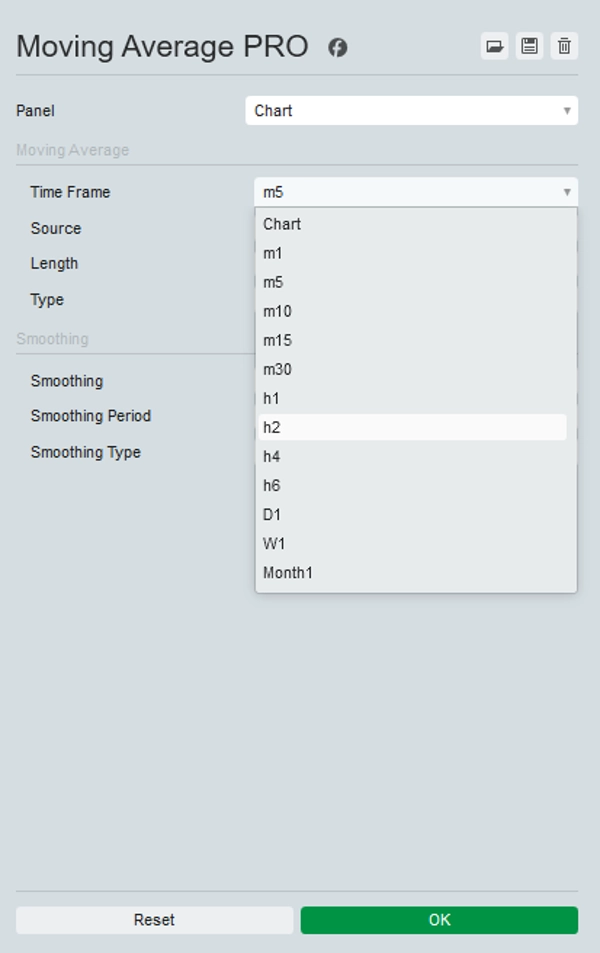
该指标允许您选择任何时间框架,使您能够在任何其他时间框架上显示例如每日200移动平均线。
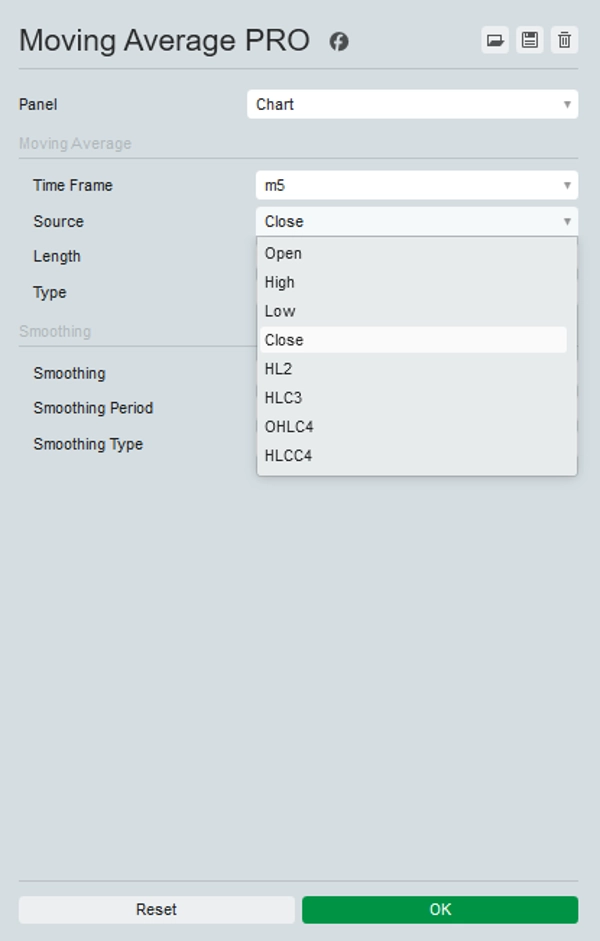
此外,它提供了一系列价格来源供选择,包括开盘价、最高价、最低价、收盘价、HL2、HLC3、OHLC4和HLCC4,就像在TradingView中一样,并提供可选的平滑选项,以解决较低时间框架上的采样问题。
通过提供这些选项,您可以定制移动平均线以适应您的特定交易策略,并获得对市场趋势更精确的洞察。
使用增强版移动平均线指标升级您的交易工具包,实现更优的分析和决策。
摘要
AI 摘要
Moving Average PRO is a customizable moving average indicator designed for trading analysis across various markets including Forex, stocks, commodities, indices, and cryptocurrencies. It allows users to select any timeframe for the moving average, enabling, for example, the display of a daily 200-period moving average on lower timeframes. The indicator supports multiple price sources such as Open, High, Low, Close, HL2, HLC3, OHLC4, and HLCC4, similar to TradingView. It also includes optional smoothing features to improve accuracy on lower timeframes and supports higher timeframe moving averages applied to tick timeframes and Heikin Ashi charts. Renko and Range periods are not supported. This flexibility allows traders to tailor the moving average to their specific strategies for enhanced market trend analysis.
指标配置
讨论
客户评价
5.0
评价:3
5 | 100 % | |
4 | 0 % | |
3 | 0 % | |
2 | 0 % | |
1 | 0 % |
客户评价
October 20, 2025
2 higher timeframe candles keeps the first run grounded, and the click feels less automatic.
October 19, 2025
makes more sense when the trader stays patient. The trader still needs to reject bad trades.
October 9, 2025
常见问答
BTCUSD
Forex
Indices
EURUSD
Commodities
GBPUSD
NZDUSD
Prop
Crypto
Stocks
XAUUSD
NAS100
USDJPY
cTrader Store 提供的所有产品,包括交易机器人、指标和插件,均由第三方开发者提供,仅供信息参考和技术访问之用。cTrader Store 并非经纪商,不提供投资建议、个人推荐或任何未来业绩保证。



























!["[Hamster-Coder] Moving Average MTF" 标识](https://cdn.ctrader.com/image/webp/b11b98b1-194d-4b8e-b00e-d611826ad159_31226)
价格

注册日期 25/09/2025
29
销售
425
免费安装