
Descripción
Presentamos el Índice de Fuerza Verdadera (TSI), una herramienta poderosa diseñada para mejorar tu estrategia de trading proporcionando información clara sobre el impulso del mercado y la fuerza de la tendencia.
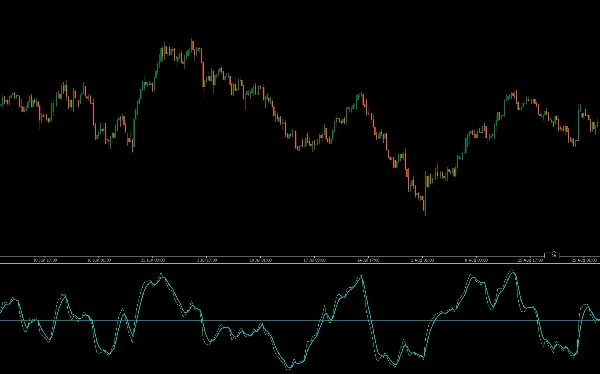
El indicador TSI mide la fuerza subyacente de los movimientos de precios, suavizando el ruido del mercado para darte una imagen más precisa de la dirección de la tendencia. Al resaltar condiciones de sobrecompra y sobreventa, el TSI te ayuda a identificar posibles puntos de reversión y confirmar continuaciones de tendencia.
El TSI utiliza medias móviles del impulso subyacente de un instrumento financiero. El impulso se considera un indicador adelantado de los movimientos de precios, y una media móvil típicamente se retrasa respecto al precio. El TSI combina estas características para crear una indicación del precio y la dirección más sincronizada con los giros del mercado que el impulso o la media móvil por separado.
Perfecto para traders que buscan refinar su análisis y mejorar la toma de decisiones, el indicador TSI ofrece una forma confiable e intuitiva de medir la dinámica del mercado. Mejora tu conjunto de herramientas de trading con el Índice de Fuerza Verdadera para un rendimiento superior en tus operaciones.
- Identificación de la tendencia: Un TSI positivo indica una tendencia alcista, mientras que un TSI negativo sugiere una tendencia bajista.
- Fuerza del impulso: Mide qué tan fuerte se está moviendo una tendencia, con valores más altos que indican un impulso más fuerte.
- Señales potenciales de reversión:
-
- Cruces: Un cruce de la línea de señal cerca de la línea cero puede señalar posibles puntos de entrada y salida.
- Divergencia: Cuando el precio alcanza un nuevo máximo o mínimo, pero el TSI no lo hace, puede indicar una posible reversión de tendencia.
- Condiciones de sobrecompra/sobreventa: Puede ayudar a identificar cuándo un activo puede estar sobrecomprado o sobrevendido, aunque los niveles específicos de sobrecompra y sobreventa pueden variar según la volatilidad del activo.
Resumen
Valoraciones de clientes
5 | 0 % | |
4 | 100 % | |
3 | 0 % | |
2 | 0 % | |
1 | 0 % |


![Logotipo de "Gaussian Channel [Iridio Capital]"](https://cdn.ctrader.com/image/webp/7c039209-5573-4a54-a072-f9528b503103_41960)
![Logotipo de "[Hamster-Coder] Pivot Points MTF"](https://cdn.ctrader.com/image/webp/4c143e5a-309c-40e3-a578-f04d1e133ffa_31159)


