
Descrição
🌐 Mudança na Estrutura do Mercado – Oscilador Profissional de Estrutura do Mercado
Identifique a Verdadeira Direção da Tendência. Filtre o Ruído. Negocie com Confiança.
Mudança na Estrutura do Mercado é um oscilador estrutural de tendência de próxima geração criado para traders que desejam clareza, precisão e confiabilidade em todas as condições de mercado.
Em vez de depender de médias móveis defasadas ou ferramentas baseadas em volatilidade, este indicador foca no núcleo do comportamento do preço: máximas oscilantes e mínimas oscilantes.
O resultado é um modelo de tendência limpo e altamente responsivo que ajuda você a identificar instantaneamente:
- Vieses reais do mercado
- Transições de estrutura
- Força de continuação da tendência
- Mudanças ocultas de momentum
Quer você faça swing trade, day trade ou opere sistemas algorítmicos, o Mudança na Estrutura do Mercado traz uma estrutura estrutural de nível profissional diretamente para seu gráfico.
🔥 Por Que a Estrutura do Mercado Importa
A maioria dos indicadores analisa o preço depois que ele já se moveu.
A estrutura do mercado funciona de forma diferente — ela mede a base do desenvolvimento da tendência:
- Máximas Mais Altas / Mínimas Mais Altas → Estrutura de alta
- Máximas Mais Baixas / Mínimas Mais Baixas → Estrutura de baixa
Isso revela a direção para a qual o mercado está se construindo, não apenas o que o preço está fazendo momento a momento.
O Mudança na Estrutura do Mercado automatiza todo esse processo e o transforma em um oscilador fácil de ler.
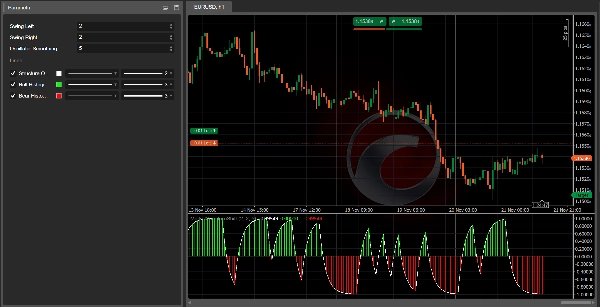
📊 O Que o Indicador Mostra
✔ 1. Linha do Oscilador de Estrutura (Branca)
Uma linha de tendência suavizada baseada em EMA que exibe claramente a estrutura dominante:
- Acima de 0 → Estrutura de alta
- Abaixo de 0 → Estrutura de baixa
- Próximo a 0 → Instabilidade da estrutura ou transição de tendência
De relance, revela onde o mercado realmente está.
✔ 2. Histograma de Alta (Verde)
Exibe força e momentum dentro de uma estrutura de alta.
Barras mais fortes = pressão ascendente mais forte.
Perfeito para confirmar configurações de compra.
✔ 3. Histograma de Baixa (Vermelho)
Mostra o momentum e a força da estrutura de baixa.
Barras mais fortes = tendência descendente mais forte.
Ideal para validar oportunidades de venda.
🎯 Como os Traders Usam (Fluxo de Trabalho Profissional)
A. Filtro de Confirmação de Tendência
Negocie apenas na direção do momentum estrutural:
- Compras quando o oscilador está acima de 0
- Vendas quando o oscilador está abaixo de 0
Essa regra simples elimina muitas configurações falsas.
B. Detecção de Reversão Estrutural
Grandes transições são visíveis quando o oscilador cruza a linha zero:
- Vermelho → Verde = Nova estrutura de alta
- Verde → Vermelho = Nova estrutura de baixa
Isso oferece uma visão antecipada das mudanças de tendência muito antes das ferramentas tradicionais reagirem.
C. Otimização Multi-Temporal
O indicador é excepcionalmente poderoso em fluxos de trabalho MTF:
- Use H4/H1 para estrutura da tendência
- Use M30/M15 para entradas
Evite negociações contra a tendência e maximize a precisão.
D. Sinergia com Sinais de Estrutura do Mercado
O Mudança na Estrutura do Mercado torna-se um sistema de negociação completo quando combinado com Sinais de Estrutura do Mercado, que fornece:
- Setas de COMPRA/VENDA
- Marcadores visuais de mudança
- Alertas de rompimento estrutural
Juntos, eles criam uma metodologia completa baseada em estrutura de cima para baixo.
⚙️ Projetado para Todos os Mercados
✔ Forex
✔ Índices
✔ Cripto
✔ Metais
✔ Mercados sintéticos
✔ Futuros (via proxies de CFD)
Altamente adaptável devido ao controle de parâmetros sobre:
- Detecção de oscilações
- Força de suavização
- Sensibilidade a mudanças estruturais
📈 Configurações Recomendadas
- Oscilação Esquerda/Direita: 2–3 para Forex e Índices, 3–3 para Cripto
- Suavização do Oscilador: 5–8 para responsividade equilibrada
Construído para funcionar imediatamente, mas totalmente personalizável.
💬 Junte-se à Nossa Comunidade para Ferramentas e Otimizações Gratuitas
Clique no link no meu perfil para entrar em nossa comunidade de traders, onde você encontrará:
- Conjuntos de parâmetros otimizados
- Ferramentas extras
- Estratégias baseadas em estrutura
- Recursos exclusivos para indicadores AlgoTrend
Um ótimo espaço para desenvolver seu sistema e melhorar a consistência.
Resumo
Traders use Market Structure Shift for trend confirmation by trading only in the direction of structural momentum, detecting structural reversals via zero-line crossings, and optimizing multi-timeframe workflows (e.g., H4/H1 for trend framework, M30/M15 for entries). It integrates with Market Structure Signals to provide buy/sell arrows, visual shift markers, and structural break alerts, forming a comprehensive structure-based trading system.
The indicator supports multiple markets including Forex, indices, cryptocurrencies, metals, synthetic markets, and futures (via CFDs). It offers customizable parameters for swing detection, smoothing, and sensitivity to structural changes, enabling adaptability across different asset classes and trading styles.
Avaliações de clientes
5 | 0 % | |
4 | 100 % | |
3 | 0 % | |
2 | 0 % | |
1 | 0 % |


