
Descrição
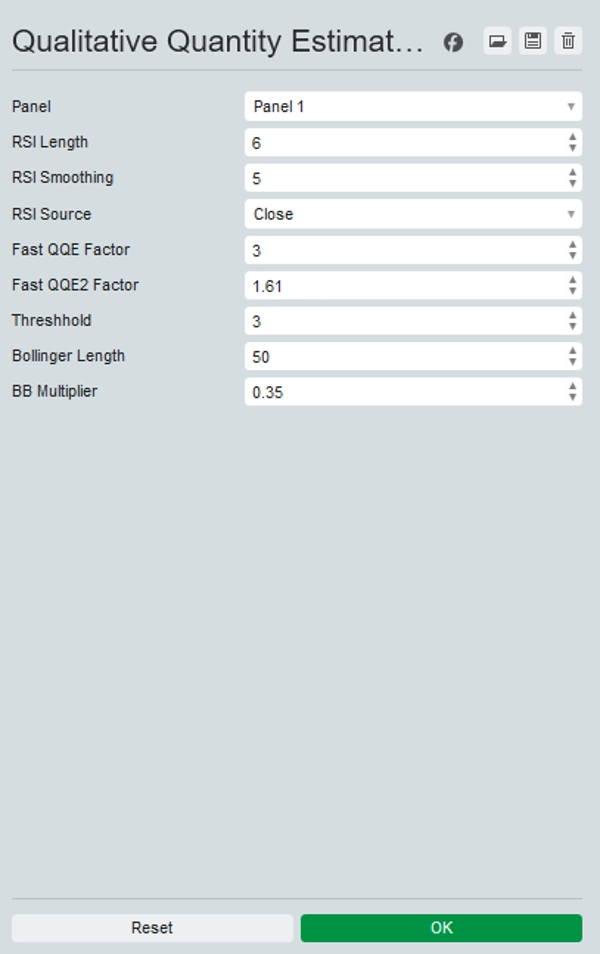
Apresentando o avançado indicador QQE (Estimativa Qualitativa Quantitativa), uma ferramenta poderosa que combina dois indicadores QQE para insights aprimorados de negociação.
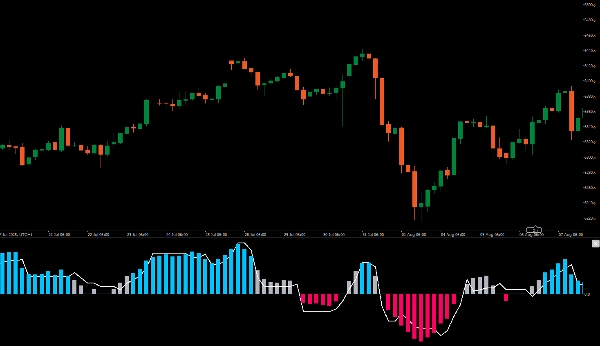
Um QQE é exibido no gráfico como colunas, enquanto o outro opera em segundo plano com uma Banda de Bollinger de 50 períodos atuando como linha zero.
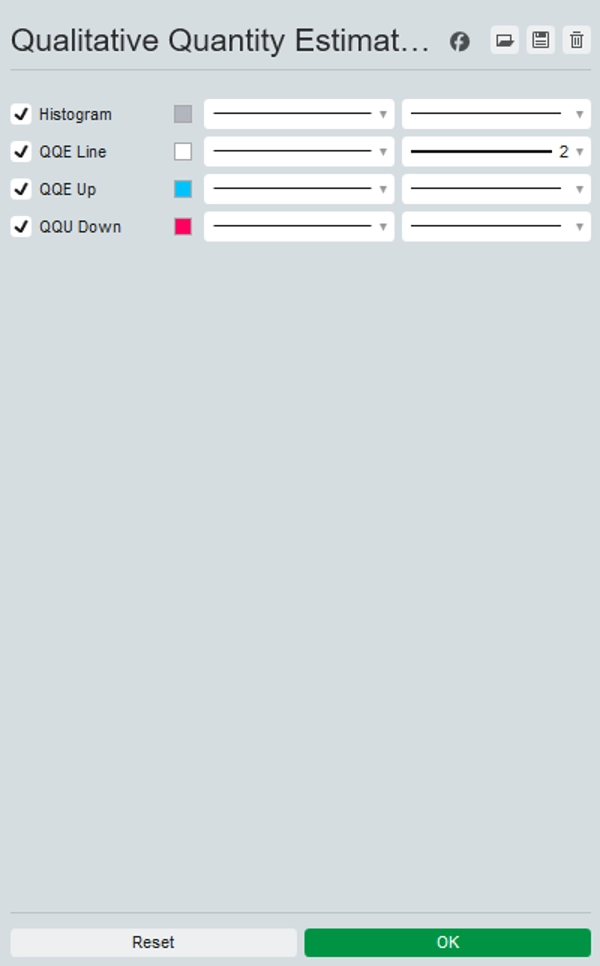
Esta configuração permite que você avalie visualmente o momentum do mercado e identifique pontos potenciais de entrada com clareza. Quando ambos os indicadores QQE se alinham, você verá barras azuis ou vermelhas claras, sinalizando fortes oportunidades de compra ou venda.
Eleve sua estratégia de negociação com o indicador QQE para decisões mais informadas e maior precisão em sua análise de mercado.Apresentando o avançado indicador QQE (Estimativa Qualitativa Quantitativa), uma ferramenta poderosa que combina dois indicadores QQE para insights aprimorados de negociação.
Um QQE é exibido no gráfico como colunas, enquanto o outro opera em segundo plano com uma Banda de Bollinger de 50 períodos atuando como linha zero.
Esta configuração permite que você avalie visualmente o momentum do mercado e identifique pontos potenciais de entrada com clareza. Quando ambos os indicadores QQE se alinham, você verá barras azuis ou vermelhas claras, sinalizando fortes oportunidades de compra ou venda.
Eleve sua estratégia de negociação com o indicador QQE para decisões mais informadas e maior precisão em sua análise de mercado.
Resumo
Avaliações de clientes
5 | 100 % | |
4 | 0 % | |
3 | 0 % | |
2 | 0 % | |
1 | 0 % |


