
Descrição
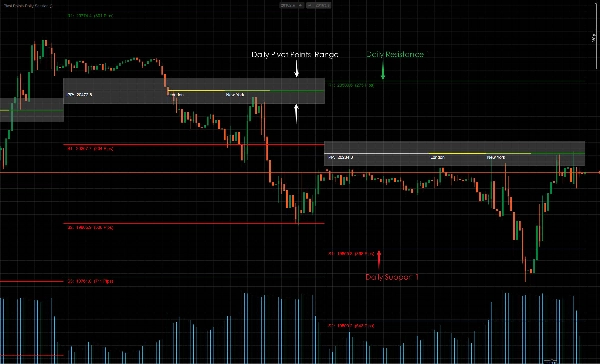
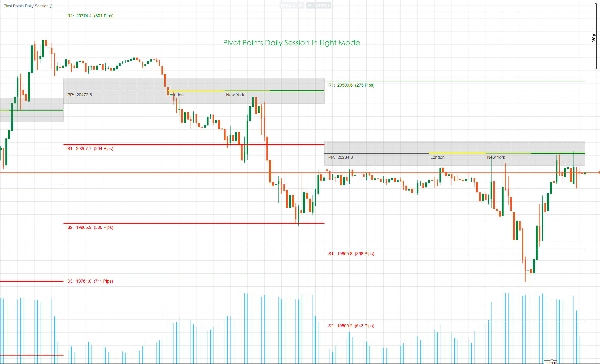
Aqui está a fórmula para calcular os Pontos de Pivô padrão:
PP = (High + Low + Close)/3
S1 = (PP * 2) – High
S2 = PP – (High – Low)
S3 = Low – 2(High – PP)
R1 = (PP * 2) – Low
R2 = PP + (High – Low)
R3 = High + 2(PP – Low)
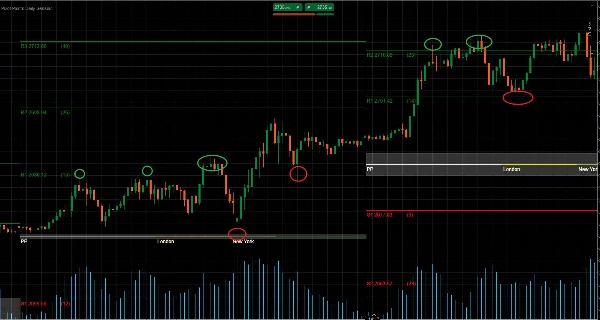
Os pontos de pivô podem ser usados para identificar a tendência geral, já que um movimento através dos pontos de pivô para cima indica uma tendência de alta. Enquanto isso, o oposto, onde o preço continua caindo abaixo dos pontos de pivô durante uma sessão, indica uma tendência de baixa.
Em um mercado lateralizado, os traders podem simplesmente vender (operar vendido) na resistência e comprar (operar comprado) no suporte. Por exemplo, se o mercado estiver contido entre R1 e S1, ordens de compra serão colocadas em torno de S1, com ordens de venda colocadas em torno de R1.
Em um mercado em tendência, os Pontos de Pivô relevantes atuarão como pontos de referência para mercados em retração retomarem a tendência principal. Por exemplo, se os preços estiverem acima do PP durante uma tendência de alta, mas abaixo de R2. Os traders podem buscar colocar ordens lucrativas de compra em torno de R1.
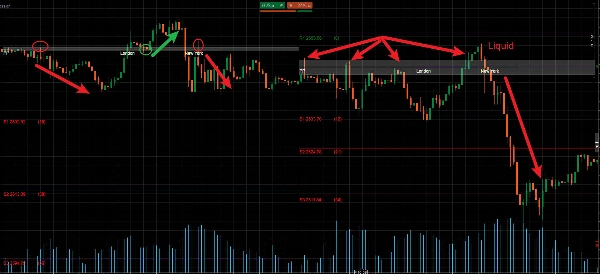
Níveis de suporte e resistência tendem a ser rompidos em alguns momentos no mercado. Esses períodos de rompimento podem oferecer muitas oportunidades de negociação no mercado. Os pontos de pivô também podem ser usados para negociar potenciais rompimentos de preço no mercado.
Rompimentos de preço ocorrem quando o preço ultrapassa um nível existente de suporte ou resistência e efetivamente troca seu papel. Por exemplo, se um rompimento para baixo ocorrer em S2, a linha de pivô deixará de ser uma linha de suporte e passará a ser considerada uma linha de resistência.
Nesse cenário, apenas ordens de venda serão consideradas abaixo de S2, e outras linhas de pivô podem guiar a colocação de stop loss e take profit. Stops para ordens de venda podem ser colocados acima de S2 e S1, com metas de lucro colocadas em S3 e abaixo.
中文说明:
枢轴点可用于识别整体趋势,因为价格向上突破枢轴点表明上升趋势。与此同时,相反的情况,即价格在交易时段内持续跌破枢轴点,则表明下降趋势。
在区间震荡市场中,交易者可以简单地在阻力位做空(卖出)和在支撑位做多(买入)。例如,如果市场在R1和S1之间波动,买单将放置在S1附近,卖单放置在R1附近。
在趋势市场中,相关的枢轴点将作为回调市场恢复主要趋势的参考点。例如,如果在上升趋势中价格高于PP但低于R2,交易者可以考虑在R1附近设置有利可图的买单。
支撑位和阻力位在某些市场情况下必然会被突破。这些突破期可以在市场中提供许多交易机会。枢轴点也可用于交易市场中潜在的价格突破。
价格突破发生在价格冲破现有的支撑位或阻力位并有效转换其角色时。例如,如果在S2处发生向下突破,该枢轴线将不再是支撑线,而将被视为阻力线。
在这种情况下,只有在S2下方才会考虑卖单,其他枢轴线可以指导止损和止盈的设置。卖单的止损可以设在S2和S1上方,盈利目标设在S3及以下。
Resumo
Avaliações de clientes
5 | 100 % | |
4 | 0 % | |
3 | 0 % | |
2 | 0 % | |
1 | 0 % |


![Logótipo de "[Stellar Strategies] MARSI Signal Plotter"](https://cdn.ctrader.com/image/webp/7b2b8da6-8f8e-4646-8d4a-4710c516c01e_25567)


