
Smart Trend Scanner
مؤشر
311 التنزيلات
الإصدار 1.0، Jan 2026
Windows, Mac
الوصف
SmartTrendScanner
نظرة عامة
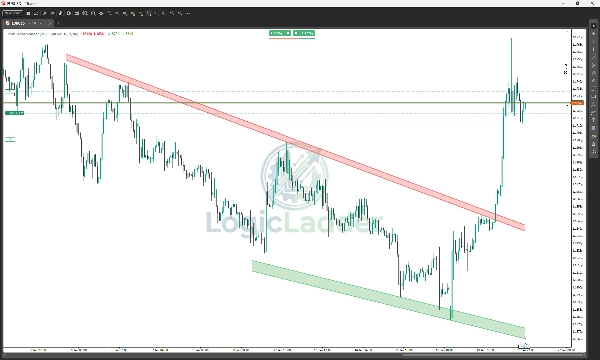
SmartTrendScanner هو مؤشر احترافي لمنصة cTrader مصمم لأتمتة الفن الذاتي لتحليل الاتجاه. على عكس المؤشرات التقليدية التي ترسم خطوط اتجاه رفيعة وسعر واحد، يقوم SmartTrendScanner بتحديد وتصوير مناطق سحابة العرض والطلب الديناميكية.
مدعومًا بخوارزمية "أفضل تطابق"، يقوم بمسح حركة السعر التاريخية للعثور على نقاط الاتصال الأكثر أهمية رياضيًا، ويرسم قنوات مملوءة تمثل المنطقة الحقيقية للدعم والمقاومة.
الميزات الرئيسية
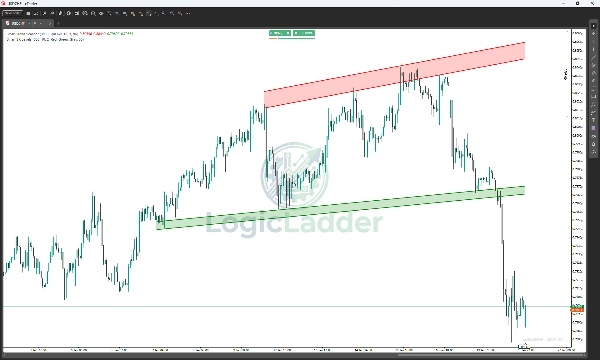
- مناطق السحابة الديناميكية: تستبدل الخطوط الرفيعة بقنوات "سحابة" مملوءة، تغطي بصريًا النطاق الكامل لمسات السعر (الفتائل والأجسام) لمنع الإشارات الكاذبة.
- كشف النقاط المحورية الذكي: يحدد تلقائيًا قمم القمم وقيعان القيعان الرئيسية بناءً على إعدادات الحساسية المخصصة الخاصة بك.
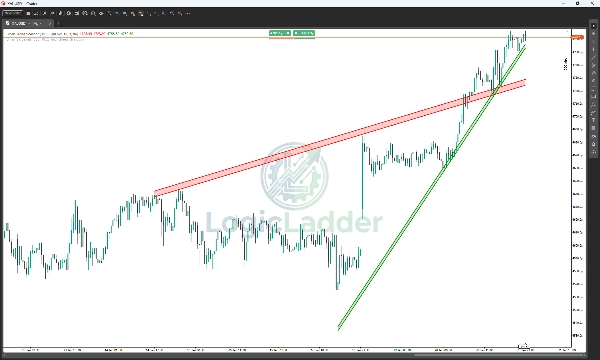
- خوارزمية أفضل تطابق: ينشئ المؤشر آلاف خطوط الاتجاه المحتملة في الخلفية ويقوم بتصفية تلك التي تعرض فقط أقوى وأهم المناطق الأقرب للسعر الحالي.
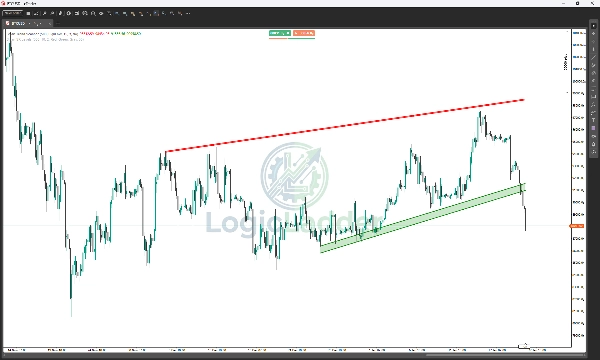
- مرشحات الاستقرار: منطق مدمج يتحقق من الهياكل المكسورة، لضمان عدم التداول على مستويات غير صالحة أو قديمة.
- تنبيهات في الوقت الحقيقي: لا تفوت أي حركة. احصل على إشعارات منبثقة وصوتية فورية عند اختراق السعر لمنطقة أو إعادة اختبار مستوى.
- قابلية التخصيص الكاملة: اضبط شفافية السحابة، الألوان، قوة النقاط المحورية، وتاريخ النظر للخلف لتناسب أسلوب تداولك (سكالبينج، التداول اليومي، أو التداول المتأرجح).
كيف يعمل
- مسح التاريخ: ينظر المؤشر إلى عدد محدد من الأعمدة حسب المستخدم (مثلاً، 300 عمود) للعثور على نقاط المحور الفركتالية.
- ربط النقاط: يختبر الاتصالات بين النقاط المحورية للعثور على ميل الاتجاهات الصالحة.
- التحقق من المنطقة: يتحقق مما إذا كان السعر قد "لمس" الخط المتوقع عددًا كافيًا من المرات (اللمسات الدنيا) دون كسره بشكل كبير في الماضي القريب.
- رسم السحابة: بمجرد العثور على اتجاه صالح، يرسم سحابة شفافة بين أعلى لمسة فتيل وأدنى لمسة جسم، مما يخلق "منطقة العمل".
دليل الإعدادات
- الأعمدة للتطبيق: إلى أي مدى يعود الماسح في التاريخ (الافتراضي: 300). زد هذا للتداول المتأرجح طويل الأجل.
- قوة المحور: حساسية الكشف الفركتالي. الأرقام الأعلى (مثلاً، 15+) تجد نقاط هيكلية رئيسية؛ الأرقام الأقل (مثلاً، 5) تجد هيكل داخلي ثانوي.
- تأكيد المحور الأدنى: الحد الأدنى لعدد المرات التي يجب أن يلمس فيها السعر المنطقة ليتم اعتبارها صالحة.
- شفافية المنطقة: يتحكم في شفافية لون التعبئة (0 = غير مرئي، 255 = صلب).
لماذا LogicLadder؟
التداول يتعلق بالاحتمالية، وليس اليقين. من خلال تصور الدعم والمقاومة كـ مناطق بدلاً من خطوط رفيعة، SmartTrendScanner يساعدك على رؤية مكان إخفاء السيولة الحقيقية، مما يبقيك خطوة واحدة أمام الجمهور.
الملخص
ملخص الذكاء الاصطناعي
Smart Trend Scanner is a professional-grade indicator for the cTrader platform that automates trend analysis by identifying and visualizing dynamic supply and demand zones as filled cloud channels rather than traditional thin trendlines. Using a "Best-Fit" algorithm, it scans historical price data to detect key swing highs and lows, connecting these pivot points to form mathematically significant support and resistance zones. The indicator validates zones by confirming multiple price touches without significant recent breaks, then draws transparent clouds between the highest wick and lowest body touches to represent true areas of market interest.
Key features include dynamic cloud zones that cover the full price range to reduce false signals, intelligent pivot detection adjustable by sensitivity, stability filters to avoid outdated levels, and real-time alerts for breakouts or retests. Users can customize settings such as lookback period, pivot strength, minimum touches for zone validation, and cloud transparency to suit various trading styles including scalping, day trading, and swing trading.
Smart Trend Scanner supports multiple markets including Forex, commodities, stocks, and cryptocurrencies, with symbol tags like BTCUSD, EURUSD, GBPUSD, XAUUSD, and NAS100. It aims to provide clearer visualization of liquidity zones to assist traders in making informed decisions based on probabilistic support and resistance areas.
ملف تعريف المؤشر
تقييمات العملاء
0.0
التقييمات: 0
تقييمات العملاء
لا توجد تقييمات لهذا المنتج حتى الآن. هل جرَّبته بالفعل؟ كن أول من يخبر الآخرين!
مناقشة
الأسئلة الشائعة
BTCUSD
Forex
EURUSD
Commodities
GBPUSD
NZDUSD
Prop
Scalping
Crypto
Stocks
XAUUSD
NAS100
USDJPY
يتم توفير المنتجات المتاحة من خلال cTrader Store، بما في ذلك روبوتات التداول والمؤشرات والإضافات، من قبل مطوري الطرف الثالث وإتاحتها لأغراض الوصول المعلوماتي والفني فقط. cTrader Store ليس وسيطًا ولا يقدم نصائح استثمارية أو توصيات شخصية أو أي ضمان للأداء المستقبلي.
المزيد من هذا المؤلف


السعر
منذ 09/01/2026
704
التثبيتات المجانية