Mô tả
TỔNG QUAN
Nền tảng: Nguyên tắc Wyckoff
Chỉ báo này được xây dựng dựa trên hai khái niệm bổ sung từ phương pháp Wyckoff:
1. Nỗ lực và Kết quả
Nguyên tắc cốt lõi của Wyckoff cho rằng chuyển động giá (kết quả) phải tỷ lệ thuận với khối lượng đứng sau nó (nỗ lực). Khi nỗ lực và kết quả hòa hợp, thị trường hoạt động bình thường. Khi chúng lệch nhau, đó là tín hiệu cho các điểm đảo chiều tiềm năng hoặc sức mạnh tiếp diễn.
Chỉ báo này trực tiếp thực hiện điều này thông qua chỉ số Hiệu quả (kết quả trên mỗi đơn vị nỗ lực) và nghịch đảo của nó, Hấp thụ (nỗ lực không chuyển thành kết quả).
2. Phân tích Biên độ
Wyckoff cũng nhấn mạnh việc phân tích đặc điểm của từng thanh giá riêng lẻ—xem xét biên độ (khoảng cách), vị trí đóng cửa trong biên độ đó, và liệu thanh giá thể hiện sự cam kết hay do dự.
Chỉ báo này thực hiện phân tích biên độ thông qua Sự cam kết (cam kết theo hướng), Tỷ lệ Lãng phí (điều chỉnh trong thanh giá), và Vị trí Đóng cửa (dùng để đặt hấp thụ vào bối cảnh tích lũy hoặc phân phối).
CHỨC NĂNG CỦA CHỈ BÁO NÀY
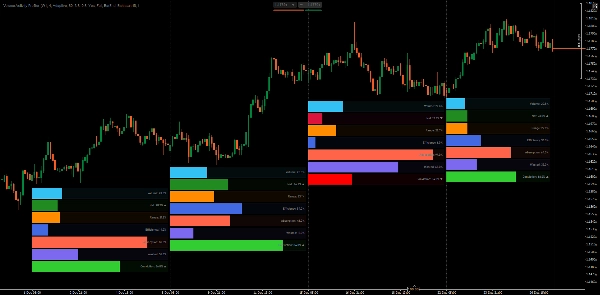
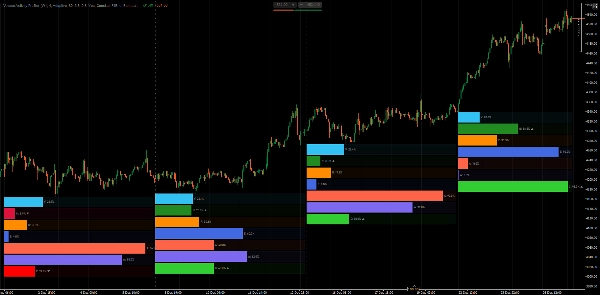
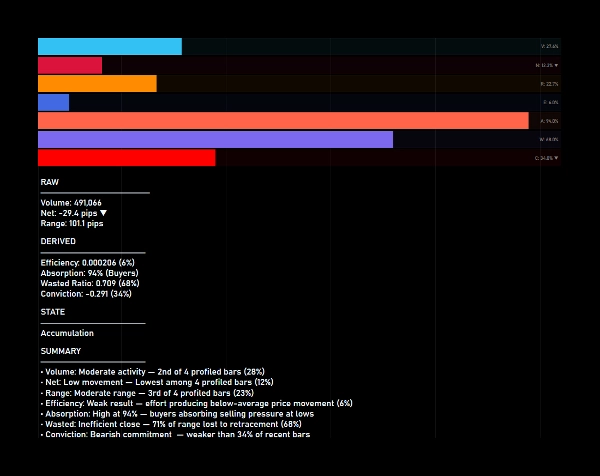
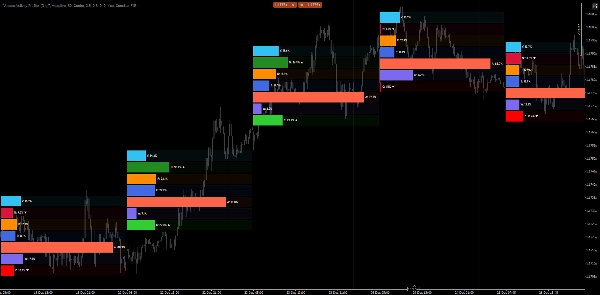
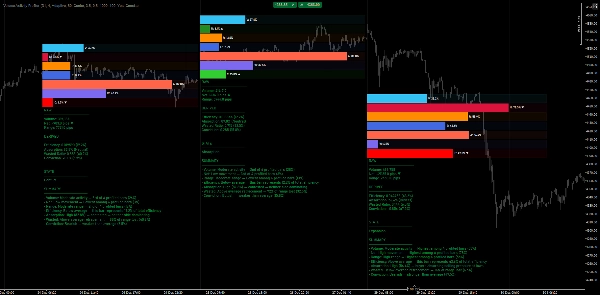
Volume Activity Profiler phân tích các thanh giá từ khung thời gian được chọn và phân tách hoạt động của chúng thành các thành phần có thể đo lường được. Nó tính toán cả các chỉ số thô và các chỉ số dựa trên phần trăm, sau đó hiển thị chúng dưới dạng biểu đồ thanh ngang gắn dưới mỗi thanh giá được phân tích.
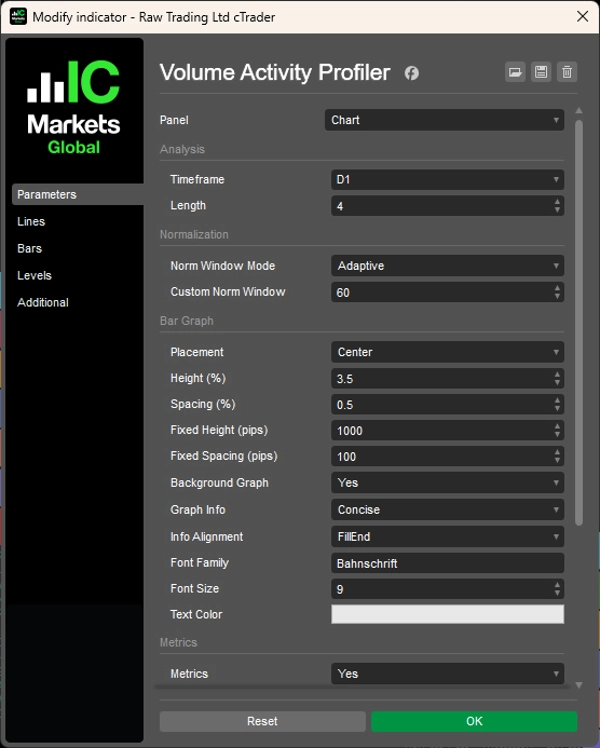
Bạn cấu hình hai tham số chính:
- Khung thời gian: Khung thời gian để phân tích (ví dụ: Hàng tuần, Hàng ngày, H4)
- Độ dài: Số thanh giá để phân tích (ví dụ: 4 thanh giá gần nhất)
Chỉ báo sau đó phân tích từng thanh giá trong phạm vi đó, tính toán các chỉ số và xếp hạng chúng so với nhau và so với các chuẩn mực lịch sử.
GIẢI THÍCH CÁC CHỈ SỐ
Chỉ số thô (tỷ lệ giữa các thanh giá được phân tích):
1. Khối lượng
Khối lượng tick của thanh giá. Cho biết tỷ lệ phần trăm khối lượng tổng thể mà thanh giá này chiếm.
2. Ròng
Chuyển động theo hướng (đóng − mở) tính bằng pip. Cho biết tỷ lệ phần trăm chuyển động ròng tổng thể. Màu sắc biểu thị hướng (xanh lá = tăng, đỏ = giảm).
3. Biên độ
Tổng biên độ giá (cao − thấp) tính bằng pip. Cho biết tỷ lệ phần trăm biên độ tổng thể trong các thanh giá được phân tích.
Chỉ số dẫn xuất (dựa trên phần trăm so với cửa sổ lịch sử):
1. Hiệu quả (Nỗ lực và Kết quả)
Biên độ tạo ra trên mỗi đơn vị khối lượng. Hiệu quả cao nghĩa là nỗ lực đang chuyển thành chuyển động giá. Hiệu quả thấp gợi ý sự hấp thụ hoặc kháng cự.
2. Hấp thụ (Nỗ lực và Kết quả)
Nghịch đảo của hiệu quả. Hấp thụ cao chỉ ra khối lượng đang bị hấp thụ mà không tạo ra chuyển động giá tương xứng—có thể là tích lũy hoặc phân phối.
3. Lãng phí (Phân tích Biên độ)
Tỷ lệ phần trăm biên độ bị mất do điều chỉnh (biên độ − ròng) / biên độ. Lãng phí cao nghĩa là thanh giá đã trả lại phần lớn chuyển động của nó. Lãng phí thấp chỉ ra thanh giá sạch, có hướng rõ ràng.
4. Cam kết (Phân tích Biên độ)
Cam kết theo hướng được đo bằng ròng/biên độ. Cam kết cao nghĩa là thanh giá đóng cửa gần cực trị của nó. Cam kết thấp chỉ ra sự do dự hoặc từ chối.
HIỂU BIỂU ĐỒ THANH
Mỗi thanh giá được phân tích hiển thị 7 thanh ngang:
- Khối lượng, Ròng, Biên độ — Được tô đầy dựa trên tỷ lệ giữa các thanh giá được phân tích
- Hiệu quả, Hấp thụ, Lãng phí, Cam kết — Được tô đầy dựa trên thứ hạng phần trăm so với dữ liệu lịch sử
Một thanh giá được tô đầy 80% ở Hiệu quả nghĩa là hiệu quả của thanh giá này cao hơn 80% các thanh giá trong cửa sổ chuẩn hóa.
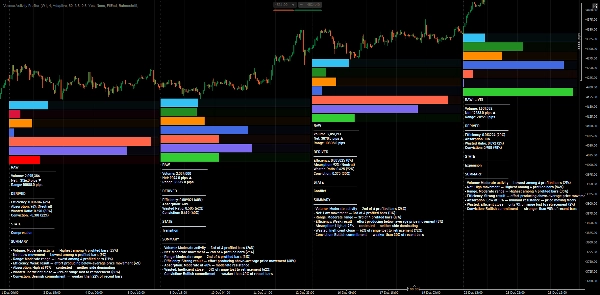
PHÂN LOẠI TRẠNG THÁI HOẠT ĐỘNG
Khi hiển thị các chỉ số được bật, chỉ báo phân loại mỗi thanh giá vào một trong các trạng thái sau:
1. Nén
Hiệu quả thấp + cam kết thấp — giá đang cuộn lại, năng lượng tiềm năng đang tích tụ
2. Mở rộng
Hiệu quả cao + cam kết cao + lãng phí thấp — chuyển động có hướng mạnh mẽ
3. Xung đột
Lãng phí cao + cam kết thấp — cuộc chiến giữa người mua và người bán
4. Tích lũy
Hấp thụ cao + đóng cửa gần mức thấp — người mua hấp thụ áp lực bán
5. Phân phối
Hấp thụ cao + đóng cửa gần mức cao — người bán hấp thụ áp lực mua
6. Từ chối
Cam kết cao nhưng đóng cửa ngược hướng — chuyển động thất bại, khả năng đảo chiều
7. Chuyển tiếp
Tín hiệu hỗn hợp — thị trường đang chuyển tiếp giữa các trạng thái
LỢI ÍCH THỰC TIỄN
- Đánh giá nhanh nỗ lực và kết quả — Ngay lập tức thấy khối lượng có tạo ra chuyển động tỷ lệ hay đang bị hấp thụ.
- Phân tích cấu trúc đa khung thời gian — Phân tích các thanh giá khung thời gian cao hơn trong khi vẫn ở khung thời gian thực thi của bạn.
- Xác định tích lũy/phân phối — Hấp thụ cao với vị trí đóng cửa tiết lộ nơi các nhà đầu tư lớn có thể hoạt động.
- Phát hiện kiệt sức và từ chối — Cam kết cao với vị trí đóng cửa ngược hướng cảnh báo khả năng đảo chiều.
- So sánh các thanh giá một cách khách quan — Xếp hạng và phần trăm loại bỏ tính chủ quan trong đánh giá khối lượng "cao" hoặc "thấp".
- Xác nhận các đột phá — Trạng thái mở rộng với hiệu quả và cam kết cao xác nhận sự quan tâm đột phá thực sự.
KHỐI LƯỢNG TICK LÀ ĐẠI DIỆN CHO NỖ LỰC
Chỉ báo này sử dụng khối lượng tick làm đầu vào nỗ lực. Trong forex, khối lượng tick thể hiện tần suất thay đổi giá hơn là khối lượng giao dịch thực tế—một hạn chế đã biết của thị trường phi tập trung.
Dù vậy, khối lượng tick vẫn hiệu quả như một đại diện cho nỗ lực vì:
- Nó phản ánh hoạt động thị trường tương đối giữa các thanh giá
- Số lượng tick cao cho thấy sự tham gia tăng của các thành viên thị trường
- Mối quan hệ nỗ lực và kết quả vẫn giữ—hoạt động cao nhưng chuyển động nhỏ vẫn báo hiệu hấp thụ
Xếp hạng phần trăm và so sánh thanh giá của chỉ báo vẫn hợp lệ miễn là dữ liệu nhất quán.
LƯU Ý
- Chỉ báo sử dụng cửa sổ chuẩn hóa thích ứng dựa trên khung thời gian khi được đặt ở chế độ Adaptive, đảm bảo bối cảnh lịch sử phù hợp.
- Tính toán phần trăm chỉ cập nhật trên các thanh giá đã hoàn thành để tránh đọc sai trên các thanh giá đang hình thành.
- Thanh giá đang hình thành hiện tại được đánh dấu bằng [LIVE] trong bảng chỉ số.
__________________________________________________________________________________________
NHIỀU CHỈ BÁO MIỄN PHÍ KHÁC
Khám phá nhiều công cụ phân tích thị trường—từ cấu trúc và khối lượng đến hồi quy, biến động và khung thời gian tùy chỉnh.
Mã nguồn có sẵn trên kho GitHub.
Tất cả đều miễn phí sử dụng. Nhưng nếu bạn muốn hỗ trợ cà phê, bạn có thể gửi qua đây.
Hỗ trợ/Kháng cự
Khối lượng
- Volume Activity Profiler
- Volume Efficiency Analyzer
- Volume Profile Analytics
- Volume Profile - Updated
- Volume Spread Analysis
- VWAP (Volume Weighted Average Price)
Đường trung bình động
- SSL Channel
- Anchored Moving Average
- Deviation-Scaled Moving Average
- Gann High Low Activator
- Instantaneous Trendline
- Kaufman Adaptive MA with Trend Vision
- Moving Average Channel
- Moving Averages Suite
- Trend Channel Moving Average
Tiện ích/Tùy chỉnh
Dựa trên hồi quy
Biến động
Bộ dao động
__________________________________________________________________________________________
TỪ CHỐI TRÁCH NHIỆM
Giao dịch có rủi ro. Chỉ báo này chỉ dành cho phân tích kỹ thuật — luôn áp dụng quản lý rủi ro phù hợp và giao dịch có trách nhiệm.
PHẢN HỒI & CẢI TIẾN
Nếu bạn có đề xuất, yêu cầu tính năng hoặc ý tưởng cải tiến, vui lòng để lại bình luận trong tab Thảo luận. Phản hồi của bạn giúp cải thiện chỉ báo cho mọi người.
Tóm tắt
The indicator profiles price bars over a user-selected timeframe and length, calculating raw metrics such as Volume (tick volume proportion), Net (directional price movement), and Range (price range). It also derives percentile-based metrics including Efficiency (price movement per volume unit), Absorption (volume without proportional price change), Wasted Ratio (retracement within the bar), and Conviction (directional commitment).
These metrics are visually represented as horizontal bar graphs beneath each analyzed bar, facilitating objective comparison and historical context. The indicator classifies bars into activity states like Compression, Expansion, Conflict, Accumulation, Distribution, Rejection, and Transition, aiding in identifying market phases and potential turning points.
Volume Activity Profiler uses tick volume as an effort proxy, reflecting relative market activity. It supports multi-timeframe analysis and updates percentile rankings on completed bars to ensure stable readings. This tool assists traders in assessing volume efficiency, spotting accumulation/distribution, confirming breakouts, and understanding market structure through quantitative volume and price bar analysis.
Đánh giá của khách hàng
5 | 100 % | |
4 | 0 % | |
3 | 0 % | |
2 | 0 % | |
1 | 0 % |