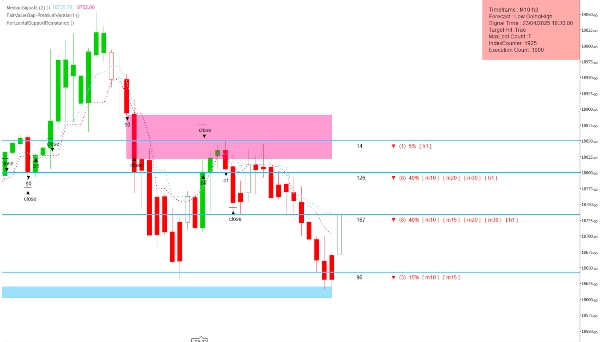
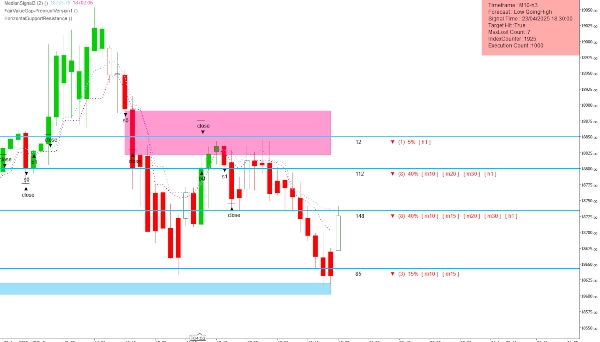
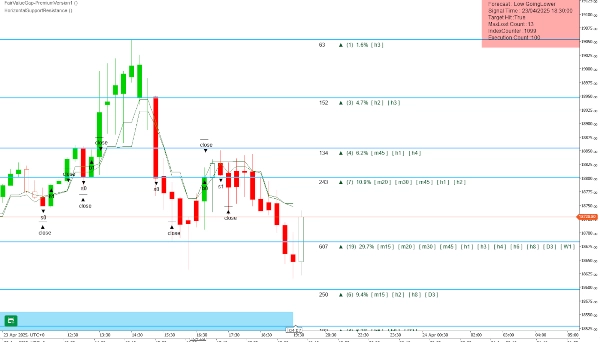
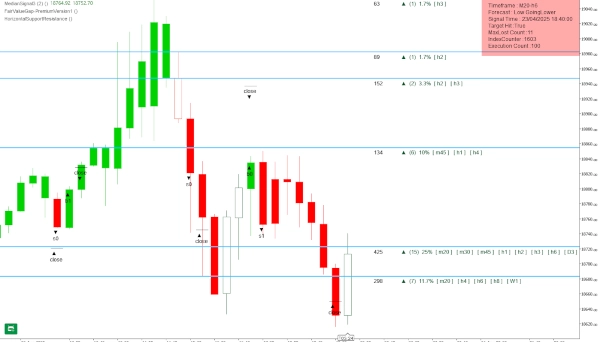
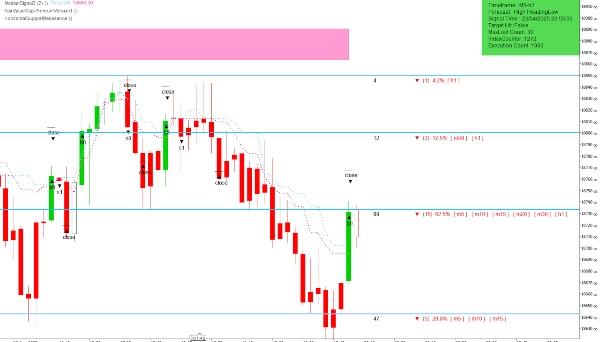
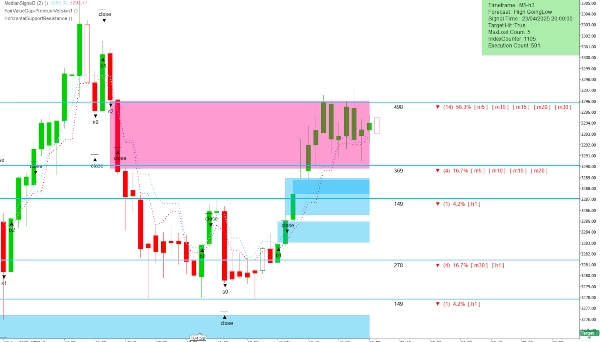
Nhà môi giới & tự doanh
Dành cho doanh nghiệp
00
Days
:
00
Hours
:
00
Minutes
:
00
Seconds
Chỉ báo
Indices
Stocks
Forex
GBPUSD
Scalping
HorizontalSupportResistance
4.5
03/09/2025
498
Desktop
Kể từ 19/04/2025
Khối lượng đã giao dịch
284.2M
Pip đạt được
1.07M
Lượt bán
7
Cài đặt miễn phí
2096
Ảnh "HorizontalSupportResistance" được tải lênẢnh "HorizontalSupportResistance" được tải lênẢnh "HorizontalSupportResistance" được tải lênẢnh "HorizontalSupportResistance" được tải lênẢnh "HorizontalSupportResistance" được tải lênẢnh "HorizontalSupportResistance" được tải lên

This extraordinary multi timeframe support and resistance indicator is nothing short of market wizardry. Designed with precision and backed by smart logic, it identifies critical price levels on all forex, indices, or stocks but especially on the NASDAQ100 with uncanny accuracy. Like a seasoned trader’s intuition encoded into a visual tool, it highlights key zones where price reacts, reverses, or accelerates—giving you an edge that feels almost supernatural. With clean candlestick representation and vibrant, clearly marked levels, this indicator doesn’t just follow the market—it anticipates it. Whether you're scalping short-term moves or holding longer-term positions, this tool acts like your personal trading oracle, quietly guiding you to smarter, more confident decisions.

4.5
Đánh giá: 2
5
50 %
4
50 %
3
0 %
2
0 %
1
0 %
Đánh giá của khách hàng
August 12, 2025
Pros: Accurate auto SR levels, customizable appearance, lightweight. Cons: No level strength filter, no alerts, possible chart clutter.
June 20, 2025
The Indicator is excellent, What's the core logic of this Indicator, Kindly share if you don't mind.
Sản phẩm khác của tác giả này
FairValueGap
This Fair Value Gap (FVG) indicator is a technical analysis tool used to identify potential price imbalances.
FairValueGap-PremiumVersion1
This Fair Value Gap (FVG) indicator is a technical analysis on multi-timeframe.
BarSentiments
This Indicator is a technical analysis tool that measures the strength and direction of market sentiment
Bạn cũng có thể thích
Chỉ báo
NAS100
NZDUSD
Martingale
+26
Kalman Filter Trend
Smarter trend detection with zero unnecessary lag.
LDE - Market Sessions
🇫🇷 Visualisez vos sessions de marché et OPR d'un coup d’œil 🇬🇧 Visualize your market sessions & OPR at a glance !
Order Block Detector SmartTrading
🎯 Order Block Detector - Smart Trading: Identifica bloques de órdenes clave en cTrader para un trading más inteligente.
Chỉ báo
NAS100
NZDUSD
XAUUSD
+13
Chandelier Exit
Optimize exits with Chandelier Exit! Visualize stop-loss points dynamically for improved trading precision and safety.
Chỉ báo
NAS100
NZDUSD
Martingale
+26
Volume Profile Suite v1.1
VolumeProfileSuite is an advanced and flexible Volume Profile indicator for cTrader.
Chỉ báo
RSI
Breakout
Signal
+1
Dynamic Trend Gradient
Identifies trends with moving averages & volatility. Base levels = bullish 🐂 or bearish 🐻 signals. Reversals detected!
Chỉ báo
NAS100
NZDUSD
XAUUSD
+10
VMM Average Median Trial
VMM Average Median - Advanced Median Indicator with Smart Trend Detection
Chỉ báo
NAS100
RSI
NZDUSD
+19
SMC + FVG Binary Signal Pro
SMC/ICT signals using FVG + liquidity sweep/MSS with EMA-RSI-MACD filters, clear visuals, and actionable alerts.
VWAP Tank Btn
Custom Vwap Indicator
mIntrinsicRecursiveValue
Intrinsic Recursive Value Indicator
Chỉ báo
Breakout
AutoLines™ Support & Resistance
FlexSR auto‑detects pivot highs/lows to plot dynamic support & resistance lines Features customizable styling and option
Chỉ báo
NAS100
NZDUSD
Martingale
+26
Deep Mood Distribution_v1.1
Deep Mood Distribution (DMD) is a segmented volume-profile and sentiment tool that analyzes price action in fixed bar bl
calculateSpreads_withSourceCode
Indicator calculates spread in pips
Chỉ báo
Indices
ATR
Stocks
+5
UT Bot Alerts Nova
UT Bot Alerts Nova: Advanced trend-following indicator using ATR for signals. Precise entries/exits.
Chỉ báo
Bollinger
Trend Channel Moving Average
Complete MA-channel system: colored trend, channel boundaries & equilibrium with 6 Fib zones.
IR VLine
don't move to the end of chart after timeframe changing. it should be better to use for near history. for long history
Price Speed or Acceleration v1
This Indicator will display either the speed or the acceleration of the current symbol.
FractalArrowBuySell
Fractal Arrow Buy and Sell Indicator