
ADXMultiframeIndicator
Chỉ báo
1 lượt mua
Phiên bản 1.0, Oct 2025
Windows, Mac
5.0
Đánh giá: 2
Mô tả
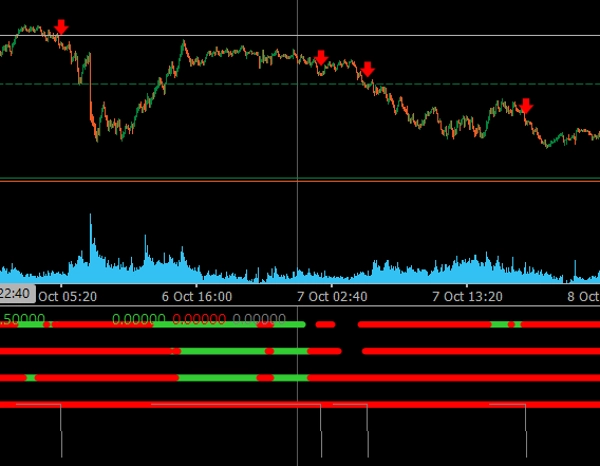
Multi-Timeframe ADX Trend Dots & Arrows là một chỉ báo giao dịch chuyên nghiệp dành cho cTrader, được thiết kế để xác định các xu hướng thị trường đồng bộ trên nhiều khung thời gian bằng cách sử dụng Chỉ số Di chuyển Hướng Trung bình (ADX).
🔹 Tính năng chính:
- ✅ Phân tích lên đến 4 khung thời gian tùy chỉnh (M15, H1, H4, Daily).
- ✅ Các chấm màu hiển thị xu hướng hướng (Xanh lá = Xu hướng tăng, Đỏ = Xu hướng giảm).
- ✅ Mũi tên tự động xuất hiện khi tất cả các khung thời gian đồng thuận cùng một hướng.
- ✅ Bộ lọc thanh liên tiếp giúp giảm tín hiệu sai hoặc sớm.
- ✅ Hình ảnh trực quan sạch sẽ, hiện đại tối ưu cho cả chủ đề biểu đồ tối và sáng.
- ✅ Hoàn hảo để phát hiện xác nhận đa khung thời gian và điểm tiếp tục xu hướng.
Chỉ báo này lý tưởng cho các nhà giao dịch muốn nhìn thấy bức tranh lớn hơn và vào lệnh chỉ khi tất cả các khung thời gian đồng thuận, cung cấp các thiết lập giao dịch mạnh mẽ và đáng tin cậy hơn.
Tóm tắt
Tóm tắt AI
The ADXMultiframeIndicator is a trading indicator for the cTrader platform that identifies market trends by analyzing the Average Directional Movement Index (ADX) across multiple timeframes. It supports up to four customizable timeframes, including M15, H1, H4, and Daily. The indicator displays colored dots to indicate directional bias—green for uptrends and red for downtrends—and automatically shows arrows when all selected timeframes align in the same direction. A consecutive bars filter is included to reduce false or premature signals. The visualization is designed to be clear and modern, compatible with both dark and light chart themes. This tool assists traders in confirming multi-timeframe trends and identifying trend continuation points by highlighting when all timeframes agree, facilitating more informed trade entries. It is particularly useful for analyzing indices markets.
Hồ sơ chỉ báo
Đánh giá của khách hàng
5.0
Đánh giá: 2
5 | 100 % | |
4 | 0 % | |
3 | 0 % | |
2 | 0 % | |
1 | 0 % |
Đánh giá của khách hàng
October 28, 2025
the first signal should not decide the only input, but it can look better than it is during a lucky run.
Thảo luận
Câu hỏi thường gặp
Indices
Các sản phẩm có sẵn trên cTrader Store, bao gồm bot giao dịch, chỉ báo và plugin, được cung cấp bởi các nhà phát triển bên thứ ba và chỉ nhằm mục đích cung cấp thông tin và tiếp cận kỹ thuật. cTrader Store không phải là nhà môi giới và không cung cấp lời khuyên đầu tư, khuyến nghị cá nhân hay bất kỳ đảm bảo nào về hiệu suất trong tương lai.
Sản phẩm khác của tác giả này


Giá
Kể từ 21/01/2025
3
Lượt bán