
Mô tả
PHIÊN BẢN CẬP NHẬT CỦA HỒ SƠ KHỐI LƯỢNG
So với phiên bản trước, phiên bản cập nhật này bao gồm các sửa lỗi quan trọng, tính năng mới và cải tiến hiệu suất đáng kể:
Sửa lỗi
- Sửa phân phối khối lượng: phân bổ tỷ lệ dựa trên sự chồng chéo của nến thay vì 100% cho tất cả các mức chạm
- Sửa phát hiện VAH/VAL: dung sai tỷ lệ với chiều cao mức thay vì giá trị mã hóa cứng
- Sửa vị trí văn bản: bù đắp dựa trên khung thời gian động thay vì ngày mã hóa cứng
- Sửa xác thực DateTime: kiểm tra thanh trống, xác thực ngoài phạm vi
Tính năng
- Thêm tham số Độ lệch Múi giờ cho hồ sơ DateTime
- Thêm tham số Vị trí Văn bản (Trái/Phải) cho chế độ nhìn lại
- Nhãn chế độ DateTime giờ đây theo cạnh thanh (chiều rộng biến đổi) hoặc căn chỉnh tại cạnh hồ sơ (chiều rộng đầy đủ)
Hiệu suất
- Tìm kiếm nhị phân cho tra cứu chỉ mục DateTime (trước đây là tuyến tính O(n))
- Tính toán tổng khối lượng được lưu trong bộ nhớ đệm (trước đây tính lại cho mỗi mức)
- Từ điển TPO được định kích thước trước để tránh thay đổi kích thước
- Mẫu TryGetValue cho tra cứu từ điển
- Vòng lặp dựa trên chỉ số thay thế foreach trong các đường dẫn nóng
Dọn dẹp
- Loại bỏ tham số ProfileWidth (tự động tính luôn đúng)
- Đơn giản hóa giao nhau nến thành điều kiện đơn
__________________________________________________________________________________________
LƯU Ý QUAN TRỌNG - ĐỌC TRƯỚC
Khối lượng Forex không phải là Khối lượng Thực
Khối lượng trong forex là khối lượng tick — nó đếm số lần giá thay đổi. Nó KHÔNG đếm số tiền đã được giao dịch.
Điều mà Khối lượng Tick không thể hiển thị
- Kích thước giao dịch. Một giao dịch 100 đô la và một giao dịch 10.000.000 đô la đều được tính là 1 tick.
- Dòng tiền thực. Bạn không thể thấy liệu tiền lớn hay tiền nhỏ đã di chuyển giá.
- Thanh khoản thực sự. Bạn không thể thấy có bao nhiêu lệnh đang chờ trên thị trường.
- Hoạt động ngân hàng. Các ngân hàng thấy dữ liệu khối lượng thực. Bạn thì không.
Điều này có nghĩa là
Khối lượng tick chỉ cho thấy tần suất giá thay đổi — không phải tiền đằng sau nó. Điều này tạo ra các vấn đề:
- Bạn không thể theo dõi các ngân hàng hoặc tổ chức. Họ sử dụng dữ liệu khối lượng thực mà bạn không có quyền truy cập.
- Bạn không thể chứng minh các lý thuyết "tiền thông minh". Những ý tưởng đó cần khối lượng thực, không phải số tick.
- Bạn không thể đánh giá thanh khoản thực sự. Hoạt động tick không cho thấy độ sâu lệnh hoặc sức mạnh thị trường thực.
- Bạn không thể đo lường sức mua hoặc bán thực sự. Nhiều giao dịch nhỏ trông giống như một giao dịch lớn của tổ chức.
- Các đột biến khối lượng có thể gây hiểu lầm. Một đột biến có thể chỉ là tiếng ồn thuật toán, không phải sự quan tâm giao dịch thực sự.
Cách sử dụng chỉ báo này đúng cách
- Xem nó như một đồng hồ đo hoạt động, không phải đồng hồ đo tiền. Khối lượng tick cao = thị trường bận rộn. Khối lượng tick thấp = thị trường yên tĩnh. Không hơn thế nữa.
- So sánh hoạt động giữa các thời điểm khác nhau. Dùng nó để xem: Phiên London có bận rộn hơn New York không? Hôm nay có hoạt động hơn hôm qua không? Giai đoạn xu hướng có bận rộn hơn giai đoạn tích lũy không?
- Kết hợp với cấu trúc giá. Dùng hỗ trợ/kháng cự, điểm swing hoặc BOS/ChoCH cùng với khối lượng. Ngữ cảnh giá giúp tránh tín hiệu sai từ các đột biến khối lượng ồn ào.
- Theo dõi hoạt động tại các mức giá quan trọng. Khi giá kiểm tra một mức quan trọng và khối lượng tick tăng, điều đó có nghĩa là nhiều nhà giao dịch đang hoạt động. Nó KHÔNG có nghĩa là các nhà chơi lớn tham gia.
- Không giả định nó thể hiện hoạt động tổ chức. Khối lượng tick không thể hiển thị tích lũy, lệnh lớn hoặc "tiền thông minh". Chỉ dùng nó để đo nhịp độ và tốc độ.
__________________________________________________________________________________________
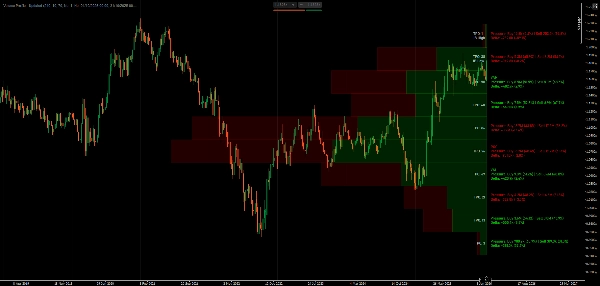
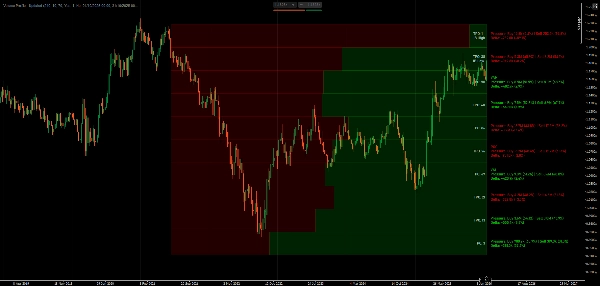
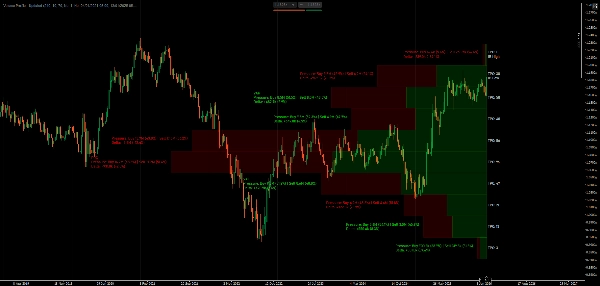
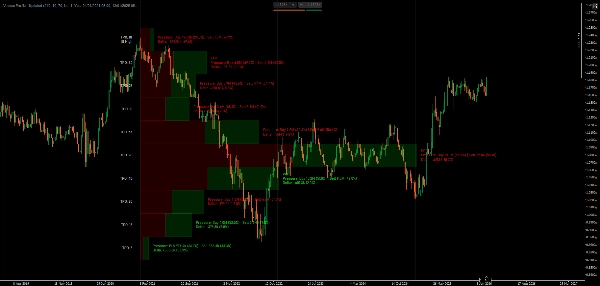
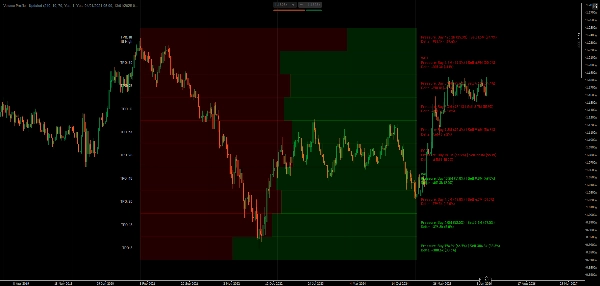
Hình dung phân phối khối lượng và thời gian dành cho giá với POC, Khu vực Giá trị và theo dõi TPO Hồ sơ Thị trường.
Chỉ báo này hiển thị phân phối khối lượng sử dụng các khái niệm Hồ sơ Thị trường. Nó hiển thị Điểm Kiểm soát (mức hoạt động tick cao nhất), ranh giới Khu vực Giá trị (nơi giao dịch nhiều nhất), chuỗi chữ cái TPO (thời gian dành cho mỗi giá), và hình ảnh delta phân tách hoạt động tick theo hướng nến.
Bạn có thể chọn các khoảng thời gian nhìn lại hoặc đặt phạm vi ngày cụ thể, hiển thị thanh khối lượng theo tỷ lệ hoặc toàn bộ chiều rộng, chuyển đổi giữa tất cả các mức hoặc chỉ các mức chính, và tùy chỉnh màu sắc cho hoạt động tăng/giảm.
TÍNH NĂNG
Phân tích Phân phối Khối lượng
- Điểm Kiểm soát (POC): Mức giá có hoạt động cao nhất — nơi giá dành nhiều thời gian nhất
- Khu vực Giá trị (VA): Vùng tập trung hoạt động có thể tùy chỉnh (mặc định 70%) — nơi giao dịch nhiều nhất
- VAH/VAL: Ranh giới Khu vực Giá trị Cao/Thấp — các mức hỗ trợ/kháng cự tiềm năng
- Hình ảnh Delta: Thanh phân tách hiển thị hướng nến tại mỗi mức giá
Hồ sơ Thị trường TPO
- Theo dõi Cơ hội Giá Thời gian: Đếm số khoảng thời gian giao dịch tại mỗi giá
- Chữ cái TPO: Biểu diễn trực quan thời gian dành cho giá (chuỗi A-Z)
- Cân bằng ban đầu (IB): Phạm vi giờ đầu tiên — quan trọng cho cấu trúc giao dịch trong ngày
- Đánh dấu Cao/Thấp IB: Cực đại phạm vi mở cửa
Tùy chọn Nhìn lại Linh hoạt
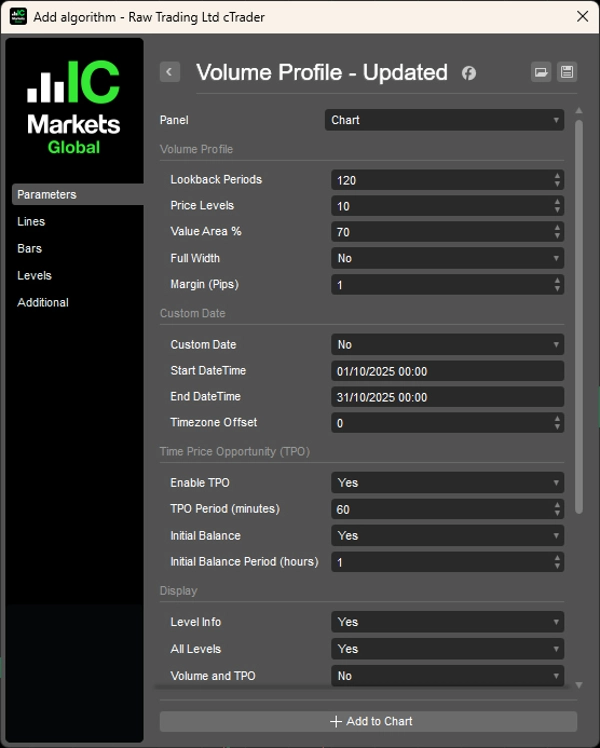
- Dựa trên khoảng thời gian: Đặt số thanh để phân tích (ví dụ, 120 thanh cuối)
- Phạm vi DateTime: Neo hồ sơ giữa các ngày/giờ cụ thể để phân tích sự kiện
- Chiều rộng động: Hồ sơ tự động điều chỉnh hoặc cố định chiều rộng
Tùy chọn Hiển thị
- Thanh Khối lượng: Chiều rộng tỷ lệ (điều chỉnh theo hoạt động) hoặc thanh đồng nhất toàn chiều rộng
- Phân tách hướng nến trong mỗi thanh
- Tính toán delta với phần trăm
- Chuyển đổi giữa tất cả các mức hoặc chỉ các mức chính (POC, VAH, VAL)
- Kiểm soát hiển thị chi tiết Volume/TPO
- Phân tích hướng với phần trăm
- Kích thước phông chữ và lề dựa trên pip có thể điều chỉnh
Tùy chỉnh Màu sắc
- Màu sắc độc lập cho thanh hướng tăng/giảm
- Màu văn bản riêng cho delta dương/âm
- Màu văn bản riêng cho TPO
Tối ưu Hiệu suất
- Lưu tra cứu thời gian trong bộ nhớ đệm và vẽ hình chữ nhật hiệu quả
- Tính toán lại tối thiểu để hiệu suất mượt mà
- Tính toán delta chuyên nghiệp dựa trên cấu trúc nến
__________________________________________________________________________________________
NHIỀU CHỈ BÁO MIỄN PHÍ HƠN
Khám phá nhiều công cụ phân tích thị trường — từ cấu trúc và khối lượng đến hồi quy, biến động và khung thời gian tùy chỉnh.
Mã nguồn có sẵn trên kho GitHub.
Tất cả đều miễn phí sử dụng. Nhưng nếu bạn muốn hỗ trợ cà phê, bạn có thể gửi tại đây.
Hỗ trợ/Kháng cự
Khối lượng
- Volume Activity Profiler
- Volume Efficiency Analyzer
- Volume Profile Analytics
- Volume Profile - Updated
- Volume Spread Analysis
- VWAP (Volume Weighted Average Price)
Đường Trung bình Động
- SSL Channel
- Anchored Moving Average
- Deviation-Scaled Moving Average
- Gann High Low Activator
- Instantaneous Trendline
- Kaufman Adaptive MA with Trend Vision
- Moving Average Channel
- Moving Averages Suite
- Trend Channel Moving Average
Tiện ích/Tùy chỉnh
Dựa trên Hồi quy
Biến động
Bộ dao động
__________________________________________________________________________________________
TỪ CHỐI TRÁCH NHIỆM
Giao dịch có rủi ro. Chỉ báo này chỉ dành cho phân tích kỹ thuật — luôn áp dụng quản lý rủi ro thích hợp và giao dịch có trách nhiệm.
PHẢN HỒI & CẢI TIẾN
Nếu bạn có đề xuất, yêu cầu tính năng hoặc ý tưởng cải tiến, vui lòng để lại bình luận trong tab Thảo luận. Phản hồi của bạn giúp cải thiện chỉ báo cho mọi người.
Tóm tắt
Key features include customizable lookback periods based on bar count or specific date/time ranges, dynamic or fixed profile widths, and display options for proportional or full-width volume bars. Users can toggle visibility of all levels or key levels (POC, VAH, VAL) and adjust colors independently for bullish/bearish bars and delta text. The indicator tracks Initial Balance (IB) ranges and marks IB High/Low for day trading structure.
Performance optimizations include binary search for DateTime lookups, cached volume calculations, and efficient data structures to minimize recalculations. The indicator uses tick volume, which counts price changes rather than actual traded volume, making it suitable as a market activity meter rather than a measure of real money flow or liquidity.
Supported markets include Forex, Indices, Commodities, Crypto, and Stocks. The indicator is intended for technical analysis and includes parameters for timezone offset and text positioning.
Đánh giá của khách hàng
5 | 100 % | |
4 | 0 % | |
3 | 0 % | |
2 | 0 % | |
1 | 0 % |


