
Daily SD Levels - Indicator
Chỉ báo
4 lượt mua
Phiên bản 1.0, Aug 2025
Windows, Mac
5.0
Đánh giá: 1
Mô tả
Mức SD Hàng Ngày – Dải Độ Lệch Chuẩn Dựa Trên VWAP Động
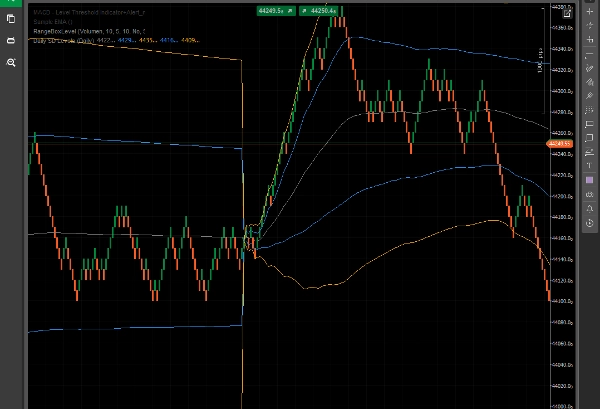
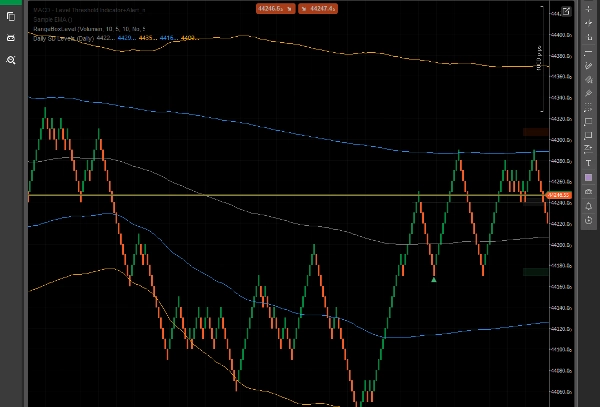
Chỉ báo Mức SD Hàng Ngày vẽ biểu đồ động VWAP (Giá Trung Bình Trọng Số Khối Lượng) và Dải Độ Lệch Chuẩn (+1/+2 và -1/-2) được tính toán trong ngày giao dịch hiện tại.
Công cụ này giúp nhà giao dịch đánh giá trực quan biến động trong ngày, các vùng hỗ trợ/kháng cự tiềm năng và các mức giá cực đoan, tất cả dựa trên khối lượng thị trường và hành động giá thực tế – không phải mức cố định hay tùy ý.
Tính Năng Chính:
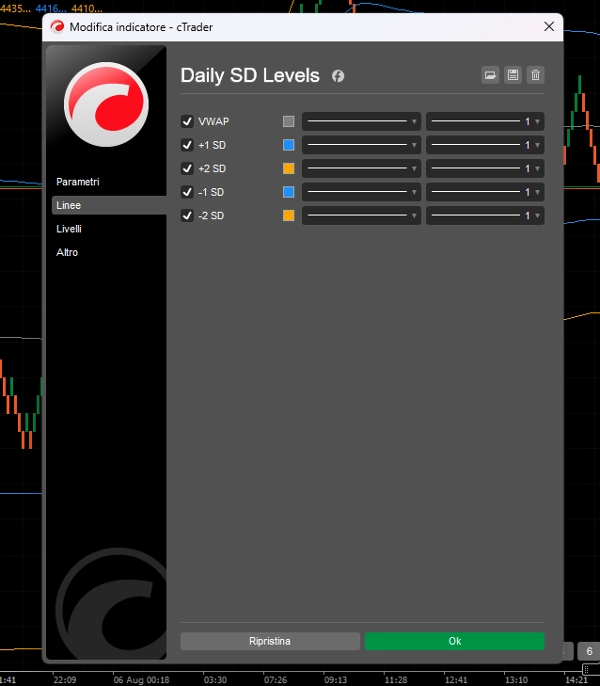
- Đường VWAP để theo dõi giá trị công bằng trong ngày.
- Dải SD +1/+2 và -1/-2 để xác định các vùng mua quá mức/bán quá mức.
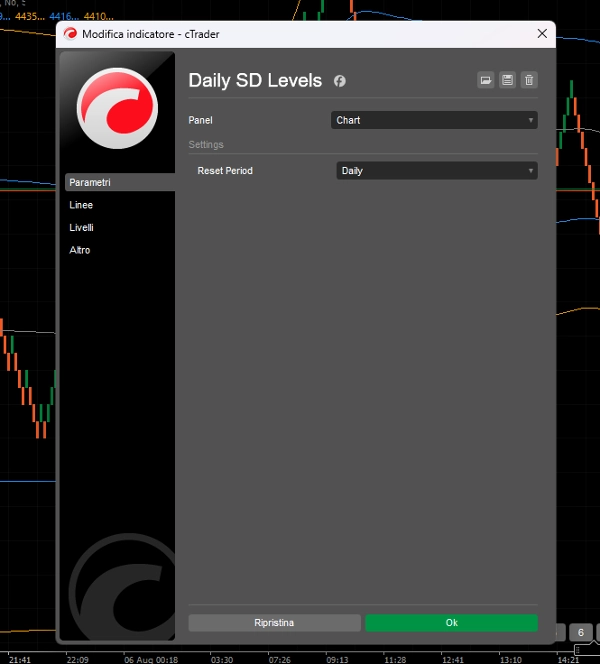
- Các mức được đặt lại hàng ngày, thích ứng với động lực giá và khối lượng của mỗi phiên.
- Tối ưu cho Renko, Range Bar và Giao dịch trong ngày.
- Dành cho nhà giao dịch cần sự rõ ràng và các vùng giá động.
Chỉ báo này hoàn hảo cho:
- Các thiết lập đảo chiều trung bình.
- Xác định các chuyển động kéo dài để có thể đảo chiều.
- Xác nhận trực quan các đột phá vượt ra ngoài giới hạn thống kê.
Không rối rắm. Chỉ có các mức rõ ràng, phản hồi nhanh di chuyển cùng thị trường.
Tóm tắt
Hồ sơ chỉ báo
Đánh giá của khách hàng
5.0
Đánh giá: 1
5 | 100 % | |
4 | 0 % | |
3 | 0 % | |
2 | 0 % | |
1 | 0 % |
Đánh giá của khách hàng
August 8, 2025
it gives context without making the decision, but the chart still needs a human read.
Thảo luận
Câu hỏi thường gặp
Các sản phẩm có sẵn trên cTrader Store, bao gồm bot giao dịch, chỉ báo và plugin, được cung cấp bởi các nhà phát triển bên thứ ba và chỉ nhằm mục đích cung cấp thông tin và tiếp cận kỹ thuật. cTrader Store không phải là nhà môi giới và không cung cấp lời khuyên đầu tư, khuyến nghị cá nhân hay bất kỳ đảm bảo nào về hiệu suất trong tương lai.


Giá
Kể từ 16/07/2025
5
Lượt bán