
Mô tả
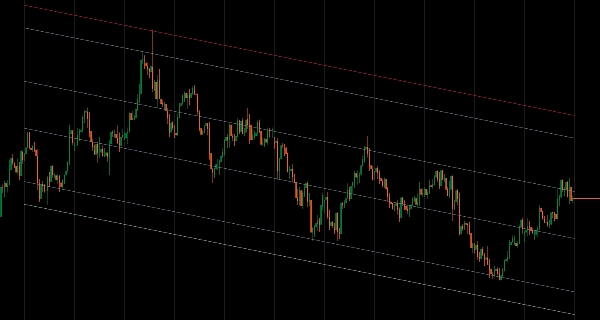
Kênh giá thống kê với các chế độ tính toán linh hoạt và hiển thị dải dựa trên độ lệch.
Phù hợp với các đường hồi quy qua dữ liệu giá sử dụng Chế độ Chu kỳ (N thanh cuối), Chế độ Ngày giờ (từ các ngày cụ thể), hoặc Cơ chế Khóa để đóng băng phân tích tại các điểm lịch sử trong khi giá tiếp tục.
Ba phương pháp độ lệch (Trung bình, Độc lập, Tối đa) cho các kênh đối xứng và không đối xứng, sáu mức thoái lui Fibonacci (11,4% đến 88,6%), phân tích đa khung thời gian, sáu loại giá (Mở/Cao/Thấp/Đóng/Trung vị/Điển hình), chế độ chỉ lịch sử để kiểm tra lại ổn định, và chiếu mở rộng vô hạn cung cấp phân tích hồi quy toàn diện cho các nhà giao dịch nhắm đến vùng hồi quy trung bình và ranh giới giá thống kê trong các điều kiện thị trường khác nhau.
TÍNH NĂNG
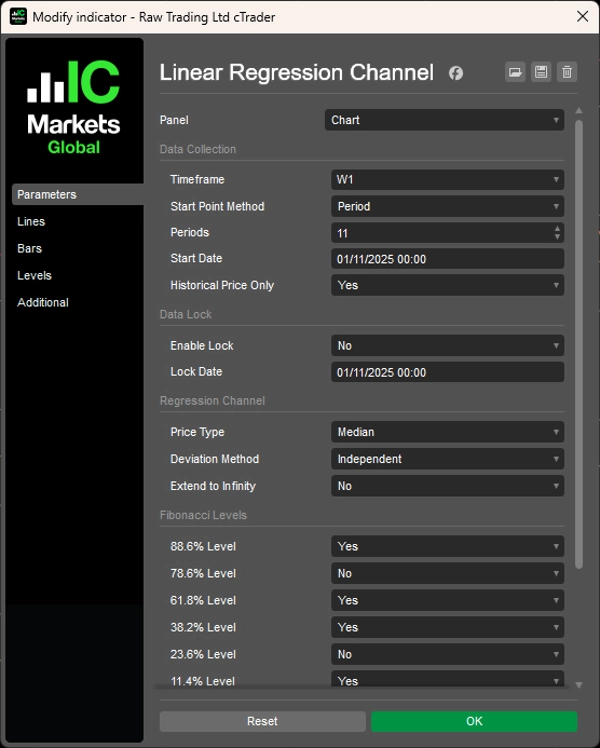
Lựa chọn dữ liệu linh hoạt
- Chế độ Chu kỳ: Phân tích N thanh cuối (ví dụ, 12 cây nến tháng cuối)
- Chế độ Ngày giờ: Bắt đầu từ các sự kiện hoặc ngày cụ thể của thị trường
- Cơ chế Khóa: Đóng băng phân tích tại một điểm lịch sử trong khi giá tiếp tục
- Đa khung thời gian: Vẽ hồi quy từ bất kỳ khung thời gian nào trên biểu đồ hiện tại của bạn
Phương pháp độ lệch thông minh
- Trung bình: Mức cân bằng sử dụng độ lệch trung bình — lý tưởng cho các vùng giao dịch
- Độc lập: Kênh không đối xứng thích ứng với biến động theo hướng
- Tối đa: Hiển thị ranh giới giá cực đoan cho phân tích toàn phạm vi
Công cụ phân tích chuyên nghiệp
- 6 mức thoái lui Fibonacci (11,4%, 23,6%, 38,2%, 61,8%, 78,6%, 88,6%)
- 6 loại giá: Mở, Cao, Thấp, Đóng, Trung vị, Điển hình
- Chế độ chỉ lịch sử: Loại bỏ các thanh đang hình thành để kiểm tra lại ổn định
- Tùy chọn mở rộng vô hạn cho các dự báo dài hạn
Tùy chỉnh toàn diện
- Tùy chỉnh màu sắc hoàn chỉnh cho tất cả các thành phần kênh
- Kiểm soát độc lập đường hồi quy và các dải độ lệch
- Trình bày trực quan sạch sẽ cho phân tích tập trung
Khả năng nâng cao
- Tính năng khóa cho các nghiên cứu phân tích dựa trên sự kiện
- Kết hợp cấu trúc khung thời gian cao hơn với thực thi khung thời gian thấp hơn
- Tùy chọn kênh đối xứng và không đối xứng cho các điều kiện thị trường khác nhau
__________________________________________________________________________________________
NHIỀU CHỈ BÁO MIỄN PHÍ HƠN
Khám phá nhiều công cụ phân tích thị trường — từ cấu trúc và khối lượng đến hồi quy, biến động và khung thời gian tùy chỉnh.
Mã nguồn có sẵn trên kho GitHub.
Tất cả đều miễn phí sử dụng. Nhưng nếu bạn muốn gửi hỗ trợ cà phê, bạn có thể chuyển đến đây.
Hỗ trợ/Kháng cự
Khối lượng
- Bộ phân tích hoạt động khối lượng
- Phân tích hiệu quả khối lượng
- Phân tích hồ sơ khối lượng
- Hồ sơ khối lượng - Cập nhật
- Phân tích phân tán khối lượng
- VWAP (Giá trung bình trọng số khối lượng)
Đường trung bình động
- Kênh SSL
- Đường trung bình động neo
- Đường trung bình động tỷ lệ độ lệch
- Bộ kích hoạt Gann Cao Thấp
- Đường xu hướng tức thời
- Đường trung bình động thích ứng Kaufman với Tầm nhìn xu hướng
- Kênh đường trung bình động
- Bộ đường trung bình động
- Đường trung bình động kênh xu hướng
Tiện ích/Tùy chỉnh
Dựa trên hồi quy
Biến động
Bộ dao động
__________________________________________________________________________________________
TỪ CHỐI TRÁCH NHIỆM
Giao dịch có rủi ro. Chỉ báo này chỉ dành cho phân tích kỹ thuật — luôn áp dụng quản lý rủi ro phù hợp và giao dịch có trách nhiệm.
PHẢN HỒI & CẢI TIẾN
Nếu bạn có đề xuất, yêu cầu tính năng hoặc ý tưởng cải tiến, vui lòng để lại bình luận trong tab Thảo luận. Phản hồi của bạn giúp cải thiện chỉ báo cho mọi người.
Tóm tắt
Đánh giá của khách hàng
5 | 100 % | |
4 | 0 % | |
3 | 0 % | |
2 | 0 % | |
1 | 0 % |


