
Mô tả
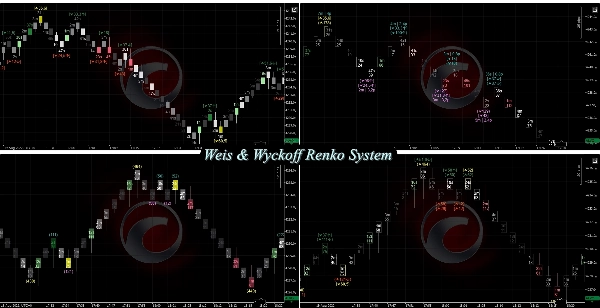
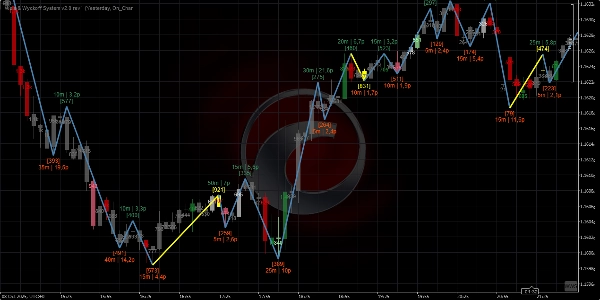
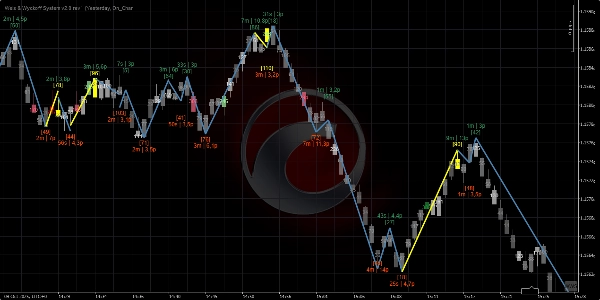
Hệ thống Weis & Wyckoff hiện hỗ trợ bất kỳ biểu đồ nào! [Nến, Tick, Renko, Range, Heikin-Ash]
Mô tả cuối cùng -> 11/11/2025
Hệ thống Weis & Wyckoff trình bày các khái niệm của David H. Weis và Richard Wyckoff
Có gì mới trong Phiên bản 1?
- Hỗ trợ các biểu đồ [Nến, Heikin-Ash, Tick, Range]
- Cải thiện ZigZag => hỗ trợ MTF + các chế độ [ATR, Phần trăm, Pips, NoLag_HighLow]
- Bao gồm tất cả các cải tiến liên quan đến "Order Flow Aggregated"
-
- MA tùy chỉnh
- Vẽ hiệu suất
- Bộ lọc sức mạnh (MA/Độ lệch chuẩn/Cả hai)
- VP_Tick() hiệu suất cao
- GetWicks() hiệu suất cao
- Thu thập dữ liệu Tick bất đồng bộ
- Sửa => Bảng tham số trên MacOS
==========================
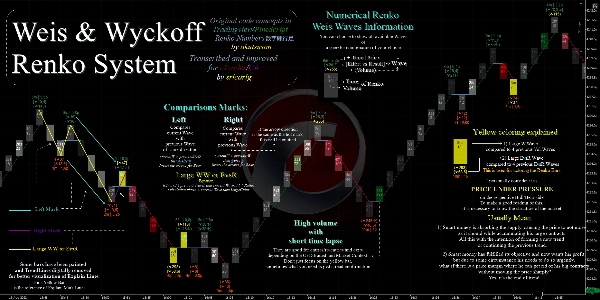
Đây chỉ là một cách để trực quan hóa các Sóng và Khối lượng theo số, không phải là một ý tưởng gốc.
Bạn có thể tìm thấy cách trực quan hóa này lần đầu tiên tại:
- David Weis về Wyckoff | Hỗ trợ/Kháng cự | và Sóng,
- Weis về biểu đồ Renko Wyckoff - Linda Raschke (gần đây nhất)
Điều này sử dụng các khái niệm mã của:
- (Numbers-Renko 数字練行足 trong PineScript),
- Cảm ơn akutsusho!.
Tôi đã cải tiến nó và đưa nó vào cTrader/C# và nó cũng miễn phí/mã nguồn mở.
=========================================
Được chuyển thể & cải tiến cho cTrader/C#
bởi srlcarlg
Mã gốc trong TradingView/Pinescript
bởi akutsusho
=========================================
Luôn ưu tiên phiên bản trên cửa hàng cTrader, nó được cập nhật trước.
Tất cả các chỉ báo tôi phát triển đều là mã nguồn mở. Nếu bạn không có quyền truy cập vào mã, hãy xem kho lưu trữ Github
Tóm tắt
Key features include:
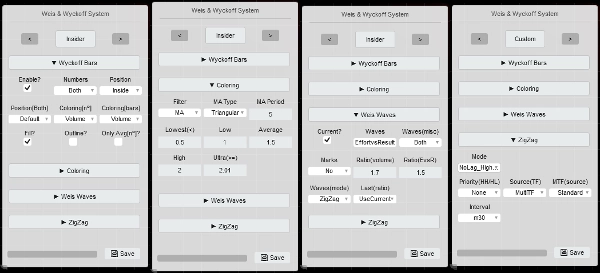
- A versatile Params Panel with four layout templates (Insider, Time, Volume, BigBrain) for quick and user-friendly customization.
- Enhanced ZigZag functionality with multi-timeframe support and multiple modes such as ATR, Percentage, Pips, and NoLag High/Low.
- Integration of order flow aggregation improvements, including custom moving averages, performance drawing, strength filters (MA, StdDev, or both), and high-performance tick volume and wick calculations.
- Dynamic TimeLapse feature showing time waves across various intervals from milliseconds to days.
- Compatibility with Mac OS and requires .NET 6.0 or higher.
The indicator is a C# adaptation and improvement of original PineScript concepts, designed to provide detailed wave and volume visualization without repainting options. It is maintained as open source, with code available on GitHub for transparency and further development.
Đánh giá của khách hàng
5 | 100 % | |
4 | 0 % | |
3 | 0 % | |
2 | 0 % | |
1 | 0 % |


![Logo "[Stellar Strategies] Smart ADX"](https://cdn.ctrader.com/image/webp/af13b084-b6f6-41db-b7bc-c7e688b57b05_36929)