
Trend Cycle
Indicateur
179 téléchargements
Version 1.0, Nov 2025
Windows, Mac
Description
Trend Cycle est un outil d'analyse de tendance qui se concentre sur la durée de la tendance, pas seulement la direction.
Il :
- Détecte les tendances haussières et baissières basées sur la pente d'une Moyenne Mobile Hull (HMA).
- Compte combien de barres la tendance actuelle a été active (Longueur Réelle).
- Stocke séparément les durées des tendances haussières et tendances baissières récentes.
- Calcule la durée moyenne des tendances haussières et baissières (Moyenne haussière / Moyenne baissière).
- Trace :
-
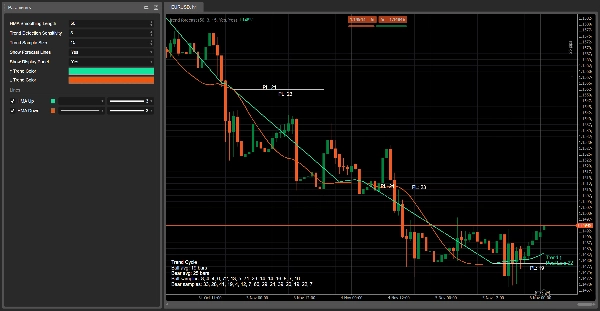
- Une HMA verte pendant les tendances haussières et une HMA rouge pendant les tendances baissières.
- Des lignes de projection horizontales au début de chaque tendance, avec une étiquette comme
PL: 18(Durée Probable en barres). - Une étiquette en direct près du prix actuel montrant la direction de la tendance et la Longueur Réelle.
- Un panneau d'affichage avec :
-
- la durée moyenne des tendances haussières et baissières,
- des listes des durées récentes des tendances (jusqu'à la taille d'échantillon sélectionnée).
L'objectif est de vous aider à répondre :
« Quel âge a cette tendance, et combien de temps les tendances comme celle-ci durent-elles habituellement ? »
Comment cela fonctionne (logique)
- Moyenne Mobile Hull (HMA)
L'indicateur calcule une Moyenne Mobile Hull du prix de clôture en utilisant le paramètre Longueur de lissage HMA.
La HMA est plus lisse qu'une simple/EMA mais réagit rapidement aux changements de direction. - Détection de tendance par pente
Sur les barres de sensibilité de détection de tendance récentes, il vérifie la HMA :
Tant qu'une tendance est définie, un compteur (Real Len) est augmenté à chaque barre, représentant la durée de la tendance actuelle. -
- Si la HMA a été strictement croissante → la tendance est haussière (↑).
- Si la HMA a été strictement décroissante → la tendance est baissière (↓).
- Sinon, elle conserve l'état de tendance précédent.
- Enregistrement des durées de tendance
Lorsque la tendance passe de haussière à baissière ou inversement : -
- La durée de la tendance terminée est stockée :
-
- les tendances haussières dans la liste haussière,
- les tendances baissières dans la liste baissière.
- Chaque liste est limitée par la taille d'échantillon de tendance (par exemple, les 10 dernières tendances).
- Ces échantillons sont utilisés pour calculer :
-
- Moyenne haussière = durée moyenne des tendances haussières.
- Moyenne baissière = durée moyenne des tendances baissières.
- Projections de Durée Probable
Au début de chaque nouvelle tendance, s'il y a suffisamment d'échantillons :
Ces projections sont gardées sur le graphique comme historique pour que vous puissiez comparer visuellement les durées de tendance prédites et réelles. -
- Il calcule la durée moyenne pour ce type de tendance (haussière ou baissière).
- Trace une ligne horizontale depuis la barre de début de tendance pour environ autant de barres.
- Place une étiquette au centre de la ligne :
-
PL: X→ Durée Probable = X barres.
- Étiquette en direct
À chaque barre, l'indicateur trace une seule étiquette en direct près de la HMA :
Cela montre la direction actuelle de la tendance et exactement combien de barres elle a duré jusqu'à présent. -
- Exemple de texte :
-
Trend ↑
Real Len: 7
- Couleur :
-
- Vert (↑) pour les tendances haussières
- Orange/rouge (↓) pour les tendances baissières
- Panneau d'affichage (en bas à gauche)
Lorsque Afficher le panneau d'affichage est activé, un panneau de texte statique apparaît dans le coin du graphique affichant :
Cela sert de vue d'ensemble statistique rapide du comportement récent des tendances sur ce symbole/période. -
- Titre : Trend Cycle
Moyenne haussière : X barresMoyenne baissière : Y barresÉchantillons haussiers :liste des durées récentes des tendances haussièresÉchantillons baissiers :liste des durées récentes des tendances baissières
Comment le lire en pratique
- HMA verte + « Trend ↑ »
→ Une tendance haussière est active.
→Real Lenvous indique combien de barres elle a duré jusqu'à présent.
→ La lignePL: Xla plus récente vous donne une idée visuelle de la durée habituelle des tendances haussières similaires. - HMA rouge + « Trend ↓ »
→ Une tendance baissière est active.
→Real Len= âge de la tendance baissière actuelle.
→ Comparez Real Len avecBear avgdans le panneau pour voir si le mouvement est jeune ou mature. - Lorsque Real Len approche ou dépasse la moyenne (Moyenne haussière / Moyenne baissière) :
→ La tendance actuelle est statistiquement « vieille » comparée à l'historique récent.
→ Vous pouvez choisir de : -
- resserrer les stops,
- verrouiller les profits,
- être plus prudent avec les nouvelles entrées dans cette direction.
- Tendances courtes vs tendances longues
-
- Beaucoup de tendances très courtes → environnement choppy / à moyenne réversible.
- Peu de longues tendances → marché plus directionnel, avec des mouvements prolongés.
Résumé
Résumé IA
Trend Cycle is a technical indicator designed to analyze trend duration in financial markets. It detects bullish and bearish trends by evaluating the slope of a Hull Moving Average (HMA) applied to closing prices, providing a smoother yet responsive measure of trend direction. The indicator counts the number of bars the current trend has been active (Real Length) and records the lengths of recent up-trends and down-trends separately. Using these samples, it calculates average durations for bullish and bearish trends.
Visual elements include a green HMA line during bullish trends and a red HMA line during bearish trends. Horizontal projection lines mark the probable length of each trend at its start, labeled with "PL: X" to indicate expected duration in bars. A live label near the current price displays the active trend direction and its age in bars. An optional display panel offers a summary of average trend durations and recent trend length samples.
Trend Cycle helps users assess how long the current trend has lasted relative to historical trends, aiding decisions such as adjusting stops or managing entries. It supports analysis across various markets including Forex, cryptocurrencies, indices, commodities, and stocks.
Profil de l'indicateur
Avis clients
0.0
Avis : 0
Avis clients
Il n'y a pas encore d'avis sur ce produit. Vous l'avez déjà essayé ? Soyez le premier à en parler aux autres !
Discussion
Questions fréquentes
BTCUSD
Forex
Signal
Breakout
Indices
EURUSD
Commodities
GBPUSD
NZDUSD
Martingale
Bollinger
Prop
ZigZag
Scalping
Supertrend
Crypto
Grid
Stocks
AI
XAUUSD
NAS100
USDJPY
Les produits disponibles sur cTrader Store, notamment les bots de trading, les indicateurs et les plug-ins, sont fournis par des développeurs tiers et mis à disposition à titre informatif et à des fins d'accès technique uniquement. cTrader Store n'est pas un courtier et ne fournit aucun conseil en investissement, aucune recommandation personnelle ni aucune garantie quant aux performances futures.


Prix
42.11M
Volume tradé
6.13M
Pips gagnés
228
Ventes
8.46K
Installations gratuites