
Mô tả
Regime Filter Pro (+ Cảnh báo)
Biến Đổi Giao Dịch Của Bạn với Phân Tích Chế Độ Thị Trường Tiên Tiến
Bạn có mệt mỏi vì bị dao động trong thị trường biến động không? Khó khăn trong việc xác định khi nào xu hướng thực sự mạnh mẽ? Chỉ báo Regime Filter là giải pháp của bạn - một công cụ mạnh mẽ giúp cắt bỏ tiếng ồn thị trường để tiết lộ sức mạnh xu hướng thực sự và động lực khối lượng.
🚀 Điều Gì Làm Cho Chỉ Báo Này Đặc Biệt?
Được xây dựng trên công nghệ Hull Moving Average (HMA) tinh vi kết hợp với phân tích khối lượng, Regime Filter cung cấp hình ảnh rõ ràng về các chế độ thị trường từ cực kỳ giảm (-10) đến cực kỳ tăng (+10). Không còn đoán mò - bạn sẽ BIẾT loại thị trường bạn đang giao dịch.
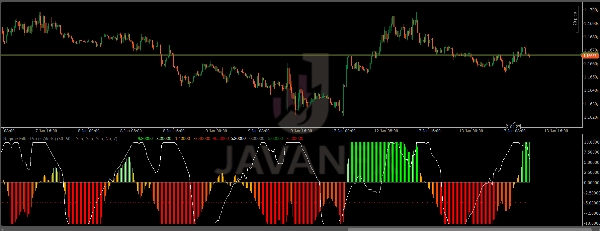
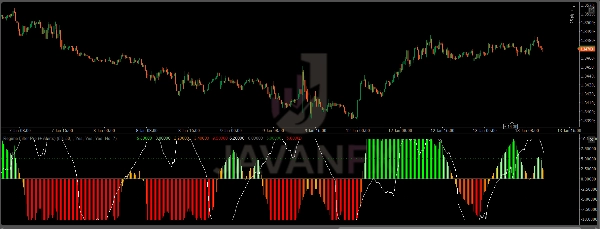
Chỉ báo có biểu đồ thanh xu hướng đa màu sắc giúp phân tích thị trường trở nên dễ dàng. Với năm vùng màu sắc riêng biệt, bạn có thể xác định chính xác sức mạnh xu hướng chỉ trong nháy mắt. Khi bạn thấy Màu xanh chanh, bạn đang chứng kiến thị trường Tăng Mạnh với giá trị từ 7 đến 10. Màu xanh nhạt biểu thị giai đoạn Tăng Yếu từ 3 đến 7. Vùng Cam đại diện cho lãnh thổ Trung tính từ -3 đến 3, nơi bạn nên thận trọng tối đa. Khi điều kiện xấu đi, Cam-Đỏ báo hiệu thị trường Giảm Yếu từ -7 đến -3, và khi bạn thấy Đỏ, bạn đang ở vùng Giảm Mạnh từ -10 đến -7.
Điều làm cho chỉ báo này khác biệt là đường xác nhận khối lượng. Không giống như các chỉ báo xu hướng khác có thể đưa ra tín hiệu sai, Regime Filter bao gồm phân tích xu hướng khối lượng riêng biệt giúp bạn tránh bị mắc kẹt trong các chuyển động yếu. Bạn sẽ luôn biết khi nào một xu hướng có động lực thực sự phía sau, và bạn sẽ phát hiện được các phân kỳ nguy hiểm giữa xu hướng giá và khối lượng trước khi chúng gây hại cho tài khoản của bạn.
Hệ thống cảnh báo thông minh là một bước đột phá khác. Chỉ báo theo dõi tích cực các điều kiện Tăng Mạnh và Giảm Mạnh khi xu hướng và khối lượng hoàn toàn đồng thuận. Nó cảnh báo bạn về các Đảo Chiều Xu Hướng mỗi khi giá cắt qua đường số không quan trọng. Có lẽ quan trọng nhất, nó phát hiện các Thay Đổi Chế Độ khi toàn bộ đặc tính thị trường chuyển từ trạng thái này sang trạng thái khác. Mỗi ngưỡng đều hoàn toàn tùy chỉnh để phù hợp với phong cách giao dịch và mức độ chấp nhận rủi ro của bạn.
💡 Cách Sử Dụng Chỉ Báo Này
Dành Cho Nhà Giao Dịch Xu Hướng
Nếu bạn là nhà giao dịch theo xu hướng, Regime Filter sẽ trở thành người bạn tốt nhất của bạn. Chiến lược này đơn giản nhưng cực kỳ hiệu quả. Bạn nên vào vị thế mua khi giá trị Xu hướng vượt quá +5 và chỉ báo Khối lượng là dương. Sự kết hợp này cho bạn biết rằng không chỉ xu hướng đang đi lên, mà còn có khối lượng hỗ trợ để duy trì chuyển động đó. Ngược lại, vào vị thế bán khi Xu hướng giảm xuống dưới -5 với xác nhận Khối lượng dương. Điều tuyệt vời của phương pháp này là biết chính xác khi nào nên thoát - ngay khi Xu hướng tiến gần về 0 hoặc bạn nhận thấy khối lượng phân kỳ với hành động giá, đó là lúc bạn nên chốt lời và rút lui.
Dành Cho Nhà Giao Dịch Swing
Nhà giao dịch swing sẽ thấy giá trị lớn khi chờ đợi các điều kiện chế độ cực đoan. Khi giá trị Xu hướng đạt ±7 hoặc cao hơn, bạn đang chứng kiến thị trường trong chế độ động lực đầy đủ. Đây là những điều kiện mà các giao dịch swing có xác suất thành công cao nhất. Chìa khóa là kiên nhẫn - chờ các vùng cực đoan này phát triển, đảm bảo bạn có xác nhận khối lượng, sau đó vào lệnh khi giá hồi trong chế độ xu hướng mạnh. Thời điểm của bạn sẽ cải thiện đáng kể vì bạn không chống lại lực lượng thị trường chi phối. Sử dụng các thay đổi chế độ làm tín hiệu để chốt lời. Khi màu sắc chuyển từ Mạnh sang Yếu, thị trường đang báo hiệu đặc tính đang thay đổi.
Dành Cho Nhà Giao Dịch Scalper
Scalper cần chọn lọc hơn với Regime Filter. Quy tắc vàng cho scalping là chỉ giao dịch khi bạn ở trong các chế độ Mạnh, được biểu thị bằng các vùng Màu xanh chanh hoặc Đỏ. Đây là những thời điểm duy nhất khi động lực thị trường đủ để thực hiện các giao dịch nhanh vào ra. Ngay khi màu sắc chuyển sang các vùng Yếu, hãy thoát ngay lập tức. Không bao giờ scalping trong vùng Cam Trung tính - đây là các giai đoạn tích lũy nơi biên độ mua bán và dao động sẽ ăn mòn lợi nhuận của bạn. Để có kết quả tốt nhất, sử dụng các khung thời gian thấp hơn như M1, M5 hoặc M15, nơi các thay đổi chế độ xảy ra thường xuyên hơn và cung cấp nhiều cơ hội trong ngày.
🎓 Mẹo Giao Dịch Chuyên Nghiệp
Hiểu được xác nhận đa khung thời gian là điều quan trọng để thành công với Regime Filter. Trước khi thực hiện bất kỳ giao dịch nào trên khung thời gian chính của bạn, luôn kiểm tra chế độ trên khung thời gian cao hơn. Nếu bạn giao dịch trên biểu đồ 15 phút, hãy kiểm tra chế độ 1 giờ hoặc 4 giờ. Hướng giao dịch của bạn nên phù hợp với chế độ khung thời gian cao hơn. Quy tắc đơn giản này sẽ giúp bạn tránh được vô số giao dịch thua lỗ khi bạn đang chống lại bức tranh lớn hơn.
Phân kỳ khối lượng là một trong những tín hiệu mạnh mẽ nhất mà Regime Filter có thể cung cấp cho bạn. Khi bạn thấy giá trị Xu hướng thể hiện sức mạnh nhưng đường Khối lượng đang giảm, hãy chuẩn bị cho khả năng đảo chiều hoặc giai đoạn tích lũy. Thị trường đang báo cho bạn biết rằng ít người tham gia hỗ trợ chuyển động này hơn, và nó có khả năng sắp hết đà. Các nhà giao dịch thông minh sử dụng điều này như một hệ thống cảnh báo sớm để thắt chặt điểm dừng hoặc chốt lời một phần.
Hãy chú ý đặc biệt đến các vùng chuyển tiếp chế độ. Một số chuyển động có lợi nhuận cao nhất trong giao dịch xảy ra khi thị trường chuyển từ chế độ Trung tính sang chế độ Mạnh. Đặt cảnh báo cho những thời điểm này và sẵn sàng hành động. Khi bạn nhận được cảnh báo rằng chế độ đã chuyển từ Cam (Trung tính) sang Xanh chanh (Tăng Mạnh), bạn đang bắt đầu một xu hướng có thể kéo dài. Những chuyển đổi này là nơi tạo ra tài sản.
Sự kết hợp phân tích chế độ với các mức hỗ trợ và kháng cự tạo ra một phương pháp giao dịch mạnh mẽ. Sử dụng Regime Filter để xác định xu hướng định hướng của bạn, sau đó kiên nhẫn chờ giá đạt đến các mức quan trọng trước khi vào lệnh. Một chế độ tăng mạnh kết hợp với việc kiểm tra mức hỗ trợ chính tạo ra một thiết lập mua có xác suất cao. Tương tự, một chế độ giảm mạnh gặp kháng cự là tín hiệu cho các lệnh bán.
Quản lý rủi ro nên thích nghi với chế độ bạn đang ở. Trong các chế độ Yếu hoặc Trung tính, giảm kích thước vị thế hoặc hoàn toàn không vào lệnh. Đây không phải là thời điểm để bạn giao dịch mạnh tay. Giữ các vị thế lớn hơn cho khi bạn ở trong các chế độ Mạnh với xác nhận khối lượng. Phương pháp điều chỉnh kích thước vị thế linh hoạt này có thể thay đổi kết quả của bạn.
Cuối cùng, hãy học cách tránh dao động mạnh. Khi cả hai chỉ báo Xu hướng và Khối lượng đều dao động gần số không, thị trường đang báo bạn nên tránh xa. Đây là các giai đoạn tích lũy nơi không có sự quyết đoán về hướng đi. Kiên nhẫn trong những thời điểm này không phải là thụ động - đó là lựa chọn chủ động để bảo toàn vốn và chờ đợi sự rõ ràng về chế độ.
📈 Hướng Dẫn Cài Đặt Tối Ưu
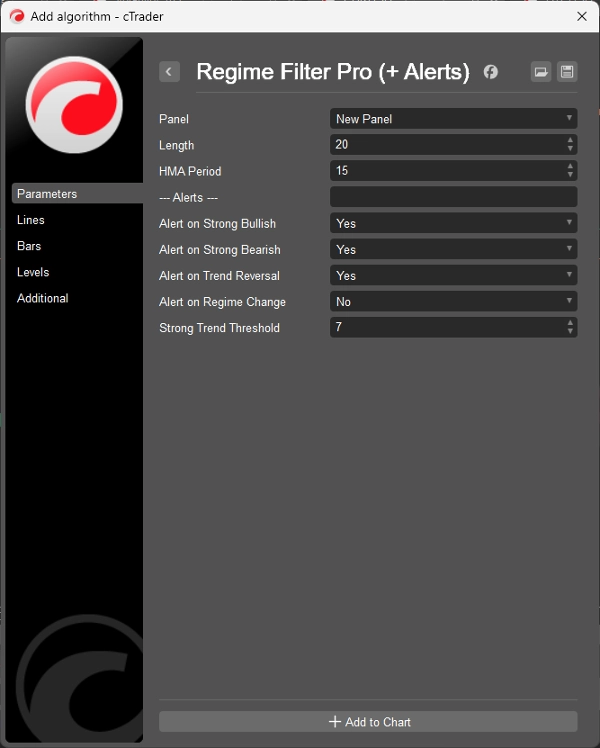
Đối với giao dịch trong ngày trên các khung thời gian M5 đến M15, bạn nên sử dụng các cài đặt phản hồi nhanh hơn. Đặt tham số Length từ 15 đến 20, HMA Period từ 10 đến 15, và Strong Threshold khoảng 6 đến 7. Các cài đặt này sẽ giúp bạn bắt kịp các thay đổi chế độ trong ngày mà không bị quá nhiều tiếng ồn.
Nhà giao dịch swing hoạt động trên biểu đồ H1 đến H4 nên tăng các tham số để có sự ổn định hơn. Length từ 20 đến 30 kết hợp với HMA Period từ 15 đến 20 hoạt động rất tốt. Đẩy Strong Threshold lên 7 hoặc 8 để đảm bảo bạn chỉ giao dịch các thiết lập swing mạnh nhất.
Nhà giao dịch vị thế nhìn vào biểu đồ hàng ngày cần các cài đặt mạnh mẽ hơn nữa. Sử dụng Length từ 25 đến 35, HMA Period từ 20 đến 25, và Strong Threshold từ 7 đến 9. Các cài đặt này lọc bỏ tiếng ồn hàng ngày và chỉ cho bạn các thay đổi chế độ có ý nghĩa quan trọng đối với các vị thế dài hạn.
Nếu bạn giao dịch các thị trường biến động như tiền điện tử, bạn cần điều chỉnh. Giảm Length từ 5 đến 10 điểm so với cài đặt tiêu chuẩn để theo kịp tốc độ nhanh hơn của thị trường crypto. Giữ HMA Period tiêu chuẩn, nhưng tăng Strong Threshold lên 8 hoặc 9 để tránh tín hiệu sai trong biến động.
🎨 Hiểu Biết Về Hình Ảnh
Khi bạn mở cửa sổ chỉ báo Regime Filter, bạn sẽ thấy một số thành phần chính hoạt động cùng nhau. Biểu đồ thanh chính là chỉ báo sức mạnh xu hướng của bạn, được tô màu theo chế độ hiện tại. Đường trắng chạy qua cửa sổ là xác nhận xu hướng khối lượng của bạn - hãy quan sát kỹ vì nó có thể xác nhận hoặc cảnh báo chống lại tín hiệu của biểu đồ thanh. Đường xám tại số không là điểm tham chiếu của bạn, phân tách vùng tăng giá phía trên và vùng giảm giá phía dưới. Cuối cùng, các đường chấm tại +5 và -5 đánh dấu các vùng ngưỡng nơi chế độ chuyển từ yếu sang mạnh.
Việc đọc biểu đồ trở nên trực quan hơn qua thực hành. Bất kỳ thanh biểu đồ nào trên số không đều cho thấy áp lực tăng giá chiếm ưu thế trên thị trường. Các thanh dưới số không báo hiệu áp lực giảm giá. Khoảng cách từ số không cho bạn biết sức mạnh của xu hướng đó - càng xa thì sự tin tưởng càng mạnh. Vị trí đường khối lượng trắng thêm bối cảnh quan trọng - khi nó tăng cùng biểu đồ thanh, bạn có xác nhận. Khi nó phân kỳ, bạn có cảnh báo.
⚡ Các Tình Huống Giao Dịch Thực Tế
Hãy để tôi dẫn bạn qua ba tình huống giao dịch thực tế để cho bạn thấy chính xác chỉ báo này mạnh mẽ như thế nào trong thực tiễn.
Trong tình huống đầu tiên, hãy tưởng tượng thị trường đã tích lũy trong vùng Cam Trung tính trong hai giờ qua. Bạn đã kiên nhẫn chờ đợi, không ép buộc giao dịch nào. Đột nhiên, giá trị Xu hướng nhảy từ +1 lên +8, chắc chắn trong vùng xanh chanh, trong khi Khối lượng đồng thời tăng lên +3. Cảnh báo của bạn lập tức được kích hoạt. Đây là tín hiệu của bạn - vào lệnh mua ngay lập tức. Chế độ đã thay đổi mạnh mẽ, và cả xu hướng lẫn khối lượng đều xác nhận chuyển động. Bạn theo xu hướng này, quan sát màu sắc cẩn thận, và khi biểu đồ thanh bắt đầu chuyển sang Xanh nhạt, bạn chốt lời. Đây là xác nhận phá vỡ tốt nhất.
Tình huống thứ hai liên quan đến phát hiện đảo chiều. Bạn đã theo dõi một chế độ giảm mạnh tàn khốc với giá trị Xu hướng kẹt ở -9 trong vùng Đỏ sâu trong nhiều giờ. Đây là một xu hướng giảm đau đớn cho bất kỳ ai giữ vị thế mua. Rồi có điều gì đó thay đổi - Xu hướng cắt qua đường số không lên +2, và cảnh báo Đảo Chiều của bạn được kích hoạt. Nhưng bạn có kỷ luật. Bạn không vào lệnh ngay lập tức. Thay vào đó, bạn chờ xác nhận, quan sát khi Xu hướng tiếp tục tăng lên +5. Bây giờ bạn có sự tin tưởng. Bạn vào lệnh mua, nhắm đến mức kháng cự trước đó đã bị phá vỡ trong đợt giảm. Chế độ chính thức đảo chiều, và bạn đã ở vị trí đúng.
Tình huống thứ ba có lẽ là giá trị nhất - nó cho bạn thấy cách chỉ báo giữ bạn tránh khỏi rắc rối. Xu hướng đột ngột tăng lên +7, và các nhà giao dịch ít kinh nghiệm có thể vội vàng vào lệnh. Nhưng bạn nhận thấy điều quan trọng - chỉ báo Khối lượng ở mức -2. Phân kỳ này là một dấu hiệu cảnh báo đỏ. Hệ thống cảnh báo của bạn không kích hoạt vì nó yêu cầu xác nhận khối lượng cho các tín hiệu Mạnh. Bạn đứng ngoài, quan sát từ bên lề. Trong vài phút, Xu hướng giảm trở lại vùng trung tính. Những gì trông như một đợt phá vỡ thực ra là một phá vỡ giả, và bạn đã tránh được cái bẫy hoàn toàn vì bạn hiểu bức tranh toàn diện mà Regime Filter đang cho bạn thấy.
🛡️ Tuyên Bố Miễn Trừ Trách Nhiệm
Trước khi bạn bắt đầu sử dụng chỉ báo này, điều cực kỳ quan trọng là bạn phải hiểu nó là gì và không phải là gì. Regime Filter là một công cụ phân tích kỹ thuật được thiết kế để hỗ trợ bạn đưa ra quyết định giao dịch tốt hơn. Nó không phải là quả cầu pha lê, không đảm bảo lợi nhuận, và không bao giờ nên được sử dụng như một hệ thống giao dịch độc lập mà không có phân tích và đánh giá của riêng bạn.
Giao dịch trên các thị trường tài chính có rủi ro mất vốn đáng kể. Mặc dù Regime Filter được thiết kế để giúp bạn nhận diện điều kiện thị trường rõ ràng hơn, không có chỉ báo nào chính xác 100%. Tín hiệu sai có thể và sẽ xảy ra. Điều kiện thị trường có thể thay đổi trong chớp mắt, nhanh hơn bất kỳ chỉ báo nào có thể thích nghi. Bạn phải luôn sử dụng các kỹ thuật quản lý rủi ro phù hợp, bao gồm điểm dừng lỗ và kích thước vị thế thích hợp.
Hiệu suất trong quá khứ của chỉ báo này, dù được thể hiện qua ảnh chụp màn hình hay mô tả trong các ví dụ, không chỉ ra kết quả trong tương lai. Mỗi thị trường khác nhau, mỗi khung thời gian hành xử khác nhau, và kết quả của bạn sẽ thay đổi dựa trên vô số yếu tố bao gồm thời điểm vào lệnh, quản lý rủi ro và kỷ luật tâm lý.
Tôi khuyên bạn nên thử nghiệm kỹ lưỡng Regime Filter trên tài khoản demo trước khi mạo hiểm vốn thật. Dành thời gian để hiểu cách nó hoạt động trên các công cụ và khung thời gian bạn ưa thích. Giữ một nhật ký giao dịch để theo dõi không chỉ thắng thua mà còn cách bạn diễn giải tín hiệu của chỉ báo. Quá trình học hỏi này vô giá và sẽ giúp bạn tiết kiệm tiền về lâu dài.
Không bao giờ mạo hiểm hơn 1% đến 2% tài khoản của bạn trên bất kỳ giao dịch đơn lẻ nào, bất kể thiết lập có vẻ mạnh đến đâu. Luôn sử dụng điểm dừng lỗ - không bao giờ cho rằng bất kỳ giao dịch nào là "đảm bảo" dựa trên tín hiệu chỉ báo. Giữ kích thước vị thế phù hợp với kích thước tài khoản và mức độ chấp nhận rủi ro của bạn. Thường xuyên nghỉ ngơi khỏi giao dịch để duy trì cân bằng cảm xúc và tránh giao dịch trả thù sau thua lỗ.
Người tạo ra chỉ báo này, mặc dù đã bỏ ra nhiều công sức phát triển và thử nghiệm, không thể và không chịu trách nhiệm về các khoản thua lỗ giao dịch mà bạn có thể gặp phải. Bạn giao dịch với rủi ro và trách nhiệm của riêng bạn. Công cụ này nên là một phần của kế hoạch giao dịch toàn diện bao gồm nhiều hình thức phân tích, quản lý rủi ro phù hợp và giáo dục liên tục.
Hãy nhớ rằng giao dịch là một cuộc chạy marathon, không phải là một cuộc chạy nước rút. Phát triển lợi nhuận ổn định cần thời gian, luyện tập và thường là một số bài học đau đớn. Sử dụng Regime Filter như một công cụ trong kho vũ khí của bạn, nhưng không bao giờ chỉ dựa vào nó. Kết hợp nó với phân tích hành động giá, các mức hỗ trợ và kháng cự, và hiểu biết của riêng bạn về động lực thị trường.
Hãy nhớ: Những giao dịch tốt nhất xảy ra khi bạn có sự rõ ràng hoàn toàn về thị trường. Regime Filter mang lại cho bạn sự rõ ràng đó. Câu hỏi là, bạn đã sẵn sàng sử dụng nó chưa?
Tóm tắt
Customizable alerts notify users of strong bullish or bearish conditions, trend reversals when crossing the zero line, and regime changes indicating shifts in market character. The tool supports various trading styles: trend traders use it to enter positions when trend and volume align strongly; swing traders focus on extreme regime values with volume confirmation; scalpers trade only in strong regimes on lower timeframes.
Settings can be adjusted for different timeframes and markets, including volatile assets like cryptocurrencies. The indicator’s visual components include the trend histogram, volume confirmation line, zero reference line, and threshold markers at ±5. It is intended as a decision-support tool to enhance market clarity and should be used alongside proper risk management and additional analysis methods.
Đánh giá của khách hàng
5 | 100 % | |
4 | 0 % | |
3 | 0 % | |
2 | 0 % | |
1 | 0 % |


