
Tsunami Volume Surge - RVOL
指标
2 购买
版本 1.0, Sep 2025
Windows 版、Mac 版
4.6
评价:3
说明
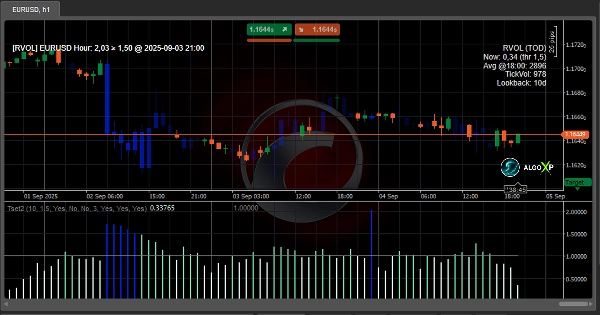
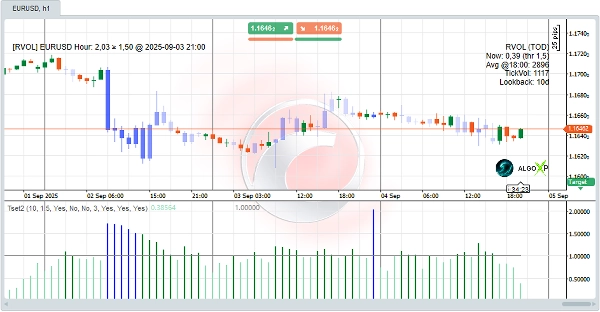
🌊 海啸成交量激增(RVOL + 时间段) 是 cTrader 的一款精准成交量工具,向您展示 市场何时真正活跃。
海啸不是查看原始成交量,而是将每根K线的活动与您选择的 回溯天数 中 同一时间段的平均值 进行比较。这种时间段归一化揭示了您可以交易的 真实参与激增:将 1.0 视为“正常”,使用 1.5–2.0 确认突破,关注 3.0+ 以捕捉爆炸性新闻行情。清晰的 RVOL 直方图、动态蜡烛颜色 以及 提醒和弹窗 让能量一目了然——在 M1–M15 时间框架内对外汇、加密货币和指数均表现轻便且快速。RVOL 数值也可以作为简单且稳健的过滤器,供您的 cBots 使用。
在 AlgoXP 上探索更多资源和详细的常见问题解答
⚡ 如何使用它进行交易(快速入门)
- 在图表上添加海啸(M1–M15 效果极佳)。设置 回溯天数(从 20–30 开始)。
- 保持 基线 1.0 可见。 RVOL < 1.0 = 安静; ≥ 1.5–2.0 = 确认突破; ≥ 3.0 = 新闻激增。
- 开启 启用提醒 并选择 仅收盘提醒(更安全)或柱内提醒(更快)。
- 使用 颜色化柱线 以即时读取能量;根据喜好调整 柱线颜色。
- (可选)在 cBots 中读取 RVOL 序列,仅过滤活跃窗口的信号。
🚀 结果: 海啸将成交量转化为 时间感知的优势 - 帮助您 跳过无效期,确认真实突破, 并在市场醒来时 更快反应。
摘要
AI 摘要
Tsunami Volume Surge - RVOL is a volume indicator designed for the cTrader platform that measures Relative Volume (RVOL) normalized by time-of-day. Instead of using raw volume data, it compares each bar’s volume to the average volume at the same time over a user-defined lookback period, highlighting genuine spikes in market participation. This approach helps traders identify when the market is truly active, distinguishing normal volume (RVOL around 1.0) from breakout confirmations (1.5–2.0) and explosive news-driven moves (3.0+).
Key features include an RVOL histogram, dynamic candle coloring for quick visual assessment, and customizable alerts with pop-ups. It operates efficiently on short timeframes (M1 to M15) and supports multiple markets such as Forex, cryptocurrencies, indices, commodities, and stocks. Additionally, RVOL values can be integrated into cBots as filters to refine automated trading signals.
The indicator aims to provide a time-aware volume edge, enabling traders to avoid low-activity periods, confirm breakouts, and respond promptly to market surges. Users can adjust settings like lookback days, alert preferences, and bar colors to tailor the tool to their trading style.
指标配置
客户评价
4.6
评价:3
5 | 67 % | |
4 | 33 % | |
3 | 0 % | |
2 | 0 % | |
1 | 0 % |
客户评价
September 21, 2025
one green trade proves nothing. Low confidence trades are easier to notice.
September 20, 2025
讨论
常见问答
BTCUSD
Forex
Indices
EURUSD
Commodities
GBPUSD
NZDUSD
Prop
Crypto
Stocks
XAUUSD
NAS100
USDJPY
cTrader Store 提供的所有产品,包括交易机器人、指标和插件,均由第三方开发者提供,仅供信息参考和技术访问之用。cTrader Store 并非经纪商,不提供投资建议、个人推荐或任何未来业绩保证。
该作者的其他作品


猜您喜欢


!["[CB] Pivot Points Pro" 标识](https://cdn.ctrader.com/image/webp/43463c82-67b0-4f10-a4ba-901bba091d81_32594)


价格
注册日期 13/08/2025
443
销售
4.67K
免费安装