설명
📈 pATR – 백분위수 평균 실제 범위
정밀 변동성. 스마트한 리스크. 기관 투자자 우위.
이 pATR 지표는 최근 실제 범위 값에 백분위수 기반 필터를 적용하여 전통적인 ATR을 재정의하며, 트레이더에게 통계적으로 근거 있는 변동성 관점을 제공합니다. 단순 평균에 의존하는 대신, pATR은 최근 가격 움직임 강도의 n번째 백분위수를 계산하여 돌파 구역, 되돌림 설정 및 리스크 임계값을 정밀하게 식별하는 데 도움을 줍니다.
프로프 펌 도전 과제를 헤쳐 나가거나 스캘핑 전략을 다듬는 중이든, pATR은 시장 상황에 적응하며 리스크를 조정하는 동적 변동성 기준을 제공합니다.
🔍 주요 특징
• 백분위수 기반 ATR: 노이즈와 극단값을 걸러내어 더 깨끗한 변동성 신호 제공
• 순환 버퍼 로직: 속도와 메모리 효율 최적화 — 지연 없음, 불필요한 데이터 없음
• 도전 모드 지원: 손실 및 거래 한도를 관리하는 프로프 펌 트레이더에 이상적
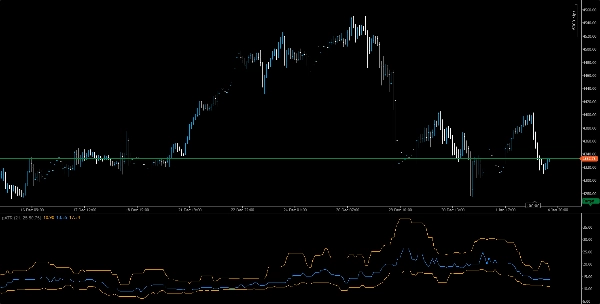
• 깔끔한 시각화: 직관적인 스케일링과 오버레이 옵션이 있는 주황색 변동성 라인
• 다중 타임프레임 호환: M1부터 H1까지 돌파, 되돌림 또는 추세 설정에 사용 가능
🧠 사용 사례
• 돌파 확인: pATR 급등을 사용하여 모멘텀 진입 검증
• 리스크 조정: 백분위수 변동성에 맞춰 손절매 및 포지션 크기 조정
• 전략 백테스팅:일관된 변동성 임계값으로 설정 검증
🎯 대상 사용자
• 규칙 기반 리스크 관리를 추구하는 프로프 펌 트레이더
• 적응형 변동성 필터가 필요한 스캘퍼 및 당일 전략가
• 백분위수 로직을 맞춤 시스템에 통합하는 정량적 트레이더
• 변동성 인지 실행을 가르치는 교육자 및 멘토
요약
Key features include an orange volatility line with intuitive scaling and overlay options, compatibility across multiple timeframes from 1-minute to 1-hour charts, and suitability for prop firm traders managing drawdowns and trade limits. pATR helps traders identify breakout zones, fade setups, and risk thresholds with precision.
Use cases cover breakout confirmation through volatility spikes, risk calibration by aligning stop-loss and position sizing with percentile volatility, and strategy backtesting using consistent volatility benchmarks. The indicator is designed for prop firm traders, scalpers, intraday strategists, quantitative traders integrating percentile logic, and educators focusing on volatility-aware execution.
Supported markets include Forex, stocks, indices, commodities, and cryptocurrencies, making pATR a versatile tool for various trading environments.