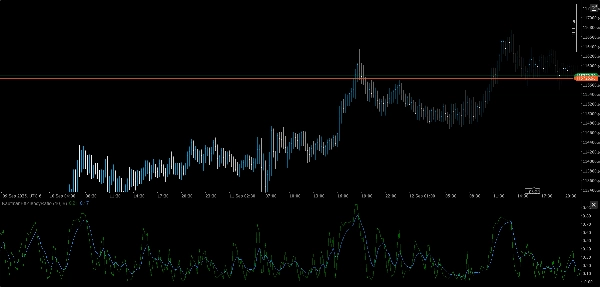
중개인 및 프랍
비즈니스용
00
Days
:
00
Hours
:
00
Minutes
:
00
Seconds
지표
Breakout
AI
Scalping
KaufmanEfficiencyRatio
13/09/2025
38
Desktop
가입일 08/08/2025
판매
7
무료 설치
1166
"KaufmanEfficiencyRatio" 업로드된 이미지

⚡ Kaufman Efficiency Ratio (KER)

Trend clarity, quantified.

The Kaufman Efficiency Ratio (KER) is a precision tool for measuring how efficiently price moves from point A to B—without getting lost in the noise. Whether you're validating breakout conditions or filtering sideways chop, KER gives you a clean score between 0 and 1 that reflects directional intent versus volatility.

🔍 What It Does

  • Calculates Kaufman’s Efficiency Ratio:
  • Outputs a normalized value from 0 (pure noise) to 1 (perfect trend)
  • Highlights trending vs. non-trending regimes with zero ambiguity
  • Ideal for adaptive overlays, regime filters, and signal gating

🛠️ Key Features

  • Modular input manager for multi-timeframe sourcing
  • Cross-asset compatible: FX, crypto, indices, equities
  • Lightweight, real-time logic with no smoothing lag
  • Plug-and-play with your existing suite architecture

🎯 Use Cases

  • Trend Validation: Confirm directional bias before signal execution
  • Noise Filtering: Suppress entries during inefficient price action
  • Regime Detection: Pair with volatility-aware overlays for smarter transitions
  • Strategy Building: Use as a core metric in breakout, momentum, or bias logic

💡 Bonus

KER is free, fast, and ruthlessly efficient—just like your code. No fluff, no filters. Just raw market intent, distilled.


0.0
리뷰: 0
고객 리뷰
이 상품에 대한 리뷰가 아직 없습니다. 이미 사용해 보셨나요? 다른 사람들에게 가장 먼저 소개해 주세요!
이 작성자의 상품 더 보기
FVG
The Indicator is a powerful tool for price-action traders seeking to identify and exploit short-term imbalances.
지표
Indices
Prop
Stocks
+3
Smooth Heiken Ashi
The Smooth Heiken Ashi indicator is a refined charting tool designed to filter out market noise and highlight true price
지표
Grid
NAS100
XAUUSD
+6
AutoFibRetracement
A powerful overlay tool designed to automatically plot Fibonacci retracement levels based on a custom window.
지표
Indices
Prop
Stocks
+3
Fractals
Fractals is a precision-engineered trading indicator for cTrader that reveals the hidden architecture of price action.
지표
NAS100
Indices
XAUUSD
+4
PrevDayProjection
Automatically calculates the previous day’s high and low, determines the range, and then projects Fibonacci levels.
지표
NAS100
Indices
XAUUSD
+7
InstitutionalSignalOscillator
A precision-engineered indicator designed for traders who demand signal integrity across volatile markets.
지표
NAS100
Indices
XAUUSD
+7
T3 Moving Average
A next‑generation moving average designed to deliver exceptional smoothness with minimal lag.
cBot
NAS100
Indices
Breakout
+4
VolatilityScalper
A trading robot designed for traders who want precision for high-volatility markets (XAUUSD, US500, US100, WTI, others.)
지표
Indices
Breakout
Prop
+6
pATR
An indicator that redefines ATR by applying a percentile-based filter giving traders a grounded view of volatility.
지표
Indices
Breakout
XAUUSD
+3
AnchoredVWAP
A precision overlay tool that combines session-aware VWAP logic and standard deviations.
지표
NAS100
Indices
XAUUSD
+6
OR Session Zones
A high‑precision Opening Range indicator that detects session opens (NY, London, EU, Tokyo, Shanghai)
DEnvelopSystem
DEnvelop is a high-performance trading indicator engineered for scalpers and intraday strategists who demand precision.
지표
Indices
Prop
Commodities
+3
OBScope
A cutting-edge indicator designed to detect and visualize high-probability zones based on swing highs, swing lows.
지표
Indices
Prop
Breakout
+3
RVI
A precision-crafted indicator that compares current volume to its historical average for the same time of day.
지표
Indices
Prop
Breakout
+8
MarketRegimeAI
A cutting‑edge trading indicator that fuses AI and mathematics with adaptive logic to classify market regimes.
지표
NAS100
Indices
XAUUSD
+6
JacksonZones
Maps intraday and multiday structure using Fibonacci-projected session ranges.
지표
Indices
Commodities
Stocks
+2
MARainbow
MARainbow gives you the edge with four customizable moving averages—each color-coded for instant recognition.
좋아하실 만한 다른 항목
지표
Breakout
Scalping
KAMAKeltner
KAMA Keltner – Adaptive Volatility Channel for Precision Trading
지표
NAS100
NZDUSD
XAUUSD
+11
TradingView ATR
Upgrade to ATR-RMA! Experience the precise ATR using Relative Moving Average for accurate volatility analysis in cTrader
IR Slowing Moving
Add Slowing to IR Moving Average.
MultiTimeFrameTrend
A compact, visual multi-timeframe trend indicator for cTrader. Easily spot bullish or bearish trends across 4 customizab
지표
RSI
Indices
Stocks
+3
FiboTrend-Pro V2
New version of one of my favorites includes Fibonacci and moving average convergence divergence lines
지표
NAS100
NZDUSD
XAUUSD
+14
VMM Signals Average Pro Trial
VmmSignalAverage PRO Trial - Professional Pattern Detection Indicator.
지표
Grid
NAS100
Breakout
+14
Dynamic ATR TPSL R-Multiple Helper
Plot ATR-based SL and 1R/2R/3R TPs instantly for any trade, with clear R-multiple risk mapping.
지표
RSI
Breakout
XAUUSD
+6
Fair Value Gap Sessions
identify and highlight temporary market inefficiencies known as "fair value gaps" 🚨 within specific trading Sessions.
지표
Indices
Prop
Commodities
+3
Levels
Price Action Zone shows previous D/W/M key levels to help frame intraday price action, liquidity, and market structure.
지표
NAS100
XAUUSD
Commodities
+10
MARKET_STRUCTURE BOS_CHoCH
MarketStructurePro – Smart BOS/CHoCH
지표
NAS100
NZDUSD
XAUUSD
+13
MACD Histogram PRO
Enhance MACD Histogram! Visualize bull and bear price changes with vibrant colors for clearer, more insightful trading.
지표
Indices
Prop
Stocks
+3
Equity and Balance
Displays real-time balance, equity, P&L, margin metrics directly on your charts.
지표
Grid
NAS100
NZDUSD
+19
Trend Cycle
Trend Cycle – measure the life of your trends. See how long the current move has been running and how long similar trend
Candle Timer & Strength Panel Demo -
Candle Timer & Strength Panel DEMO for cTrader DEMO VERSION – 24 hours free trial! This is a DEMO version of the Candle
Chaikin Money Flow
Chaikin money flow's primary purpose is to distinguish between periods of accumulation and distribution of a security.
지표
Forex
Signal
USDJPY
Yen Strength - Line Momentum
Single-line JPY Strength Indicator: Track yen momentum swiftly across key pairs—achieve clarity in your forex trades!
지표
NAS100
NZDUSD
XAUUSD
+11
Session HighLow Pivot Points Indicator advanced version
Visualize global trading sessions with colored range boxes. Track New York, London, Tokyo, and Sydney sessions
지표
Grid
NAS100
RSI
+19
Delta-RSI Candle Pro
Delta RSI Candle Pro