설명
📈 AutoFibRetracement 지표
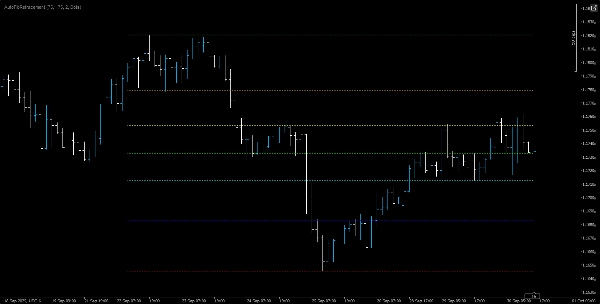
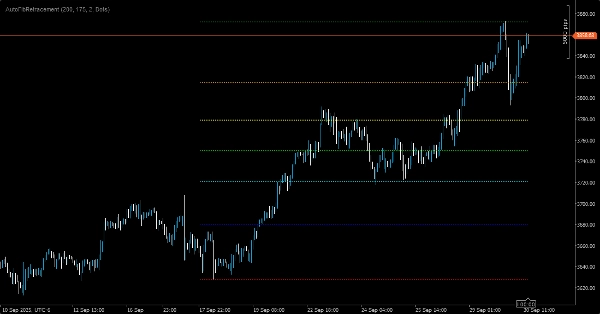
AutoFibRetracement 지표는 최근 가격 변동을 기반으로 피보나치 되돌림 수준을 자동으로 표시하도록 설계된 강력한 오버레이 도구입니다. 잠재적인 지지 및 저항 구역을 식별하려는 트레이더에게 이상적이며, 사용자 정의 가능한 매개변수를 사용하여 되돌림 수준을 동적으로 계산하고 차트에 직접 표시합니다.
🔧 주요 기능:
• 자동 스윙 감지: 사용자 정의 조회 창 내에서 스윙 고점과 저점을 계산합니다.
• 사용자 정의 기간 창: 트레이더는 의미 있는 스윙 고점과 저점을 정확하게 포착하기 위해 적절한 창을 선택해야 합니다. 이 선택은 되돌림 수준을 실제 시장 구조와 일치시키는 데 매우 중요합니다.
• 피보나치 수준: 표준 비율 — 0%, 23.6%, 38.2%, 50%, 61.8%, 78.6%, 100% — 각 비율은 시각적 명확성을 위해 색상으로 구분됩니다.
• 시각적 스타일 옵션:
• 선 투명도를 위한 조절 가능한 불투명도(0–255).
• 선 두께 및 스타일(예: 점선, 실선) 구성 가능.
• 오버레이 표시: 다른 기술 분석 도구와 원활하게 통합되도록 가격 차트에 직접 그립니다.
🎯 사용 사례:
스윙 트레이더, 추세 추종자 및 피보나치 되돌림 구역을 기반으로 진입, 청산 및 손절매 수준을 계획하는 기술 분석가에게 적합합니다. 이 지표의 효과는 트레이더가 올바른 창 크기를 선택하는 능력에 달려 있습니다 — 너무 짧으면 넓은 스윙을 놓칠 수 있고, 너무 길면 최근 가격 움직임이 희석될 수 있습니다.