
Beschreibung
Wenn Sie nach einem dynamischen Fibonacci-Kanalindikator für cTrader suchen, sind Sie hier genau richtig. Dieser Indikator zeichnet automatisch Fibonacci-Bänder parallel zu einem gleitenden Durchschnitt Ihrer Wahl. Er ist benutzerfreundlich und bietet, wie meine anderen Indikatoren, Benachrichtigungen per Pop-up, Ton, E-Mail und Telegram-Nachrichten. Außerdem haben Sie die Flexibilität, die Bänder, Fibonacci-Niveaus und Alarme anzupassen.
Hier ist eine Liste seiner Funktionen:
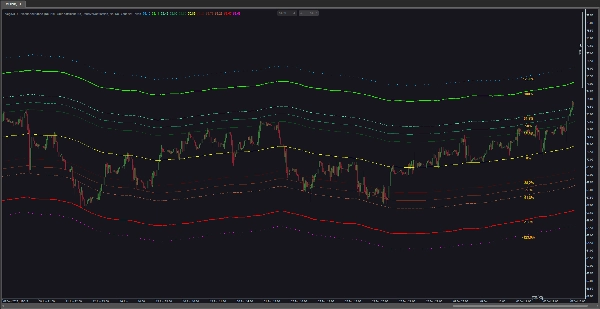
- Berechnung der Fibonacci-Bänder: Der Indikator berechnet und zeichnet Fibonacci-Bänder basierend auf dem von Ihnen ausgewählten gleitenden Durchschnitt. Diese Bänder basieren auf Fibonacci-Niveaus (z. B. 0,0 %, 38,2 %, 61,8 % oder andere) und erstrecken sich oberhalb und unterhalb des gleitenden Durchschnitts um einen festgelegten Faktor.
- Konfiguration des gleitenden Durchschnitts: Passen Sie den Typ des gleitenden Durchschnitts an (z. B. Einfach, Exponentiell usw.) und die Anzahl der Perioden, die in der Berechnung verwendet werden. Der gleitende Durchschnitt dient als Grundlage für die Fibonacci-Bänder.
- Alarmfunktionalität: Der Indikator bietet verschiedene Alarmoptionen, um Händler über bestimmte Ereignisse zu informieren. Dazu gehören Alarme bei Berührung von Kursniveaus und Annäherungsalarme.
- Alarme bei Berührung von Kursniveaus: Konfigurieren Sie den Indikator so, dass Alarme ausgelöst werden, wenn der Kurs bestimmte Fibonacci-Niveaus berührt. Die Alarme können auf dem Schlusskurs basieren oder sofort ausgelöst werden, wenn der Kurs das Niveau berührt.
- Annäherungsalarme: Richten Sie Annäherungsalarme ein, um Benachrichtigungen zu erhalten, wenn sich der Kurs einem bestimmten Fibonacci-Niveau innerhalb einer definierten Entfernung nähert oder sich davon entfernt. Alarme können ausgelöst werden, wenn sich der Kurs dem Niveau nähert oder sich entfernt.
- Ausgabeoptionen für Alarme: Wählen Sie aus Tonalarmen, Pop-ups, Telegram-Nachrichten und E-Mail-Benachrichtigungen für Alarme. Tonalarme können durch Auswahl verschiedener Sounddateien angepasst werden.
- Visualisierungsoptionen: Passen Sie die Visualisierung der Fibonacci-Niveaus mit Optionen wie der Anzeige von Prozentwerten, der Festlegung der Farbe für Prozentbeschriftungen, der Steuerung der Position der Beschriftungen im Chart, dem Ein- und Ausschalten bestimmter Bänder sowie der Wahl von Farbe, Dicke und Erscheinungsbild der Bänder an.
- Konfigurierbare Fibonacci-Niveaus: Passen Sie den Indikator an Ihre Handelsstrategie an, indem Sie die spezifischen Fibonacci-Niveaus, die in der Berechnung verwendet werden, anpassen. Positive und negative Fibonacci-Niveaus können individuell konfiguriert werden.
- Integrierte Benutzeranleitung: Sie können die Benutzeranleitung für diesen Indikator direkt aus dem Chart heraus aufrufen.
Zusammenfassend kombiniert der VegaXLR - Fibonacci Bands Indikator Fibonacci-Analyse und gleitende Durchschnitte, um potenzielle Unterstützungs- und Widerstandsniveaus zu identifizieren. Mit konfigurierbarer Alarmfunktionalität und Visualisierungsoptionen ist er ein unverzichtbares Werkzeug für Händler, die auf Fibonacci-Retracements oder -Erweiterungen setzen.
Zusammenfassung
It features multiple alert options including price level touch alerts—triggered on price contact or close at specified Fibonacci levels—and proximity alerts that notify when price approaches or moves away from these levels within a defined range. Alerts can be delivered via pop-up, sound (with customizable sounds), email, and Telegram messages.
Visualization settings enable customization of band colors, thickness, label display and position, and selective enabling or disabling of bands. A built-in user guide is accessible directly from the chart for ease of use.
Overall, VegaXLR - Fibonacci Bands combines Fibonacci retracement and expansion analysis with moving averages to assist traders in identifying potential support and resistance zones, enhanced by configurable alerts and visualization options.
Kundenbewertungen
5 | 100 % | |
4 | 0 % | |
3 | 0 % | |
2 | 0 % | |
1 | 0 % |


