
Consolidation Zones
Indikator
1 käufe
Version 1.0, Oct 2025
Windows, Mac
4.0
Bewertungen: 1
Beschreibung
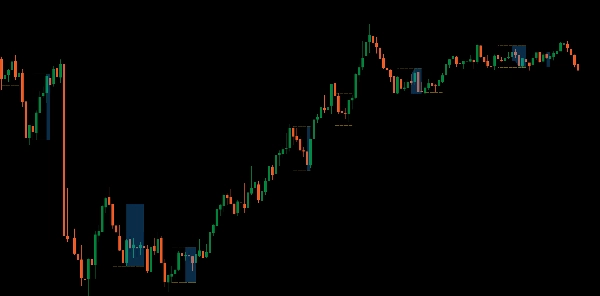
Wir stellen den Consolidation Zones Indikator vor, der Ihnen hilft, Ausbruchsgelegenheiten einfach zu erkennen und zu nutzen.
Dieses leistungsstarke Tool hebt Zonen in Ihrem Chart hervor, in denen sich der Preis konsolidiert, was es einfach macht, potenzielle Ausbruchspunkte zu erkennen. Durch die Visualisierung dieser kritischen Bereiche können Sie Marktbewegungen besser antizipieren und fundiertere Handelsentscheidungen treffen.
Ideal für Trader, die ihre Strategie mit klaren und umsetzbaren Erkenntnissen verbessern möchten, erweitern Sie Ihr Trading-Toolkit und meistern Sie Ausbrüche mit dem Consolidation Zones Indikator.
Zusammenfassung
KI-Zusammenfassung
The Consolidation Zones indicator identifies and visualizes price consolidation areas on trading charts to help traders spot potential breakout points. By highlighting these zones, it assists in anticipating market movements and supports more informed decision-making. This tool is applicable across multiple markets, including Forex, cryptocurrencies (e.g., BTCUSD), commodities (e.g., gold, oil), indices (e.g., NAS100, SP500), and stocks. It is designed to enhance trading strategies focused on breakout opportunities by providing clear visual cues of consolidation phases.
Indikatorprofil
Kundenbewertungen
4.0
Bewertungen: 1
5 | 0 % | |
4 | 100 % | |
3 | 0 % | |
2 | 0 % | |
1 | 0 % |
Kundenbewertungen
October 12, 2025
Two timeframes give more context, and the log becomes easier to read.
Diskussion
Häufig gestellte Fragen (FAQ)
BTCUSD
Forex
Breakout
Indices
EURUSD
Commodities
GBPUSD
NZDUSD
Prop
Crypto
Stocks
XAUUSD
NAS100
USDJPY
Über den cTrader Store verfügbare Produkte, einschließlich Handelsbots, Indikatoren und Plugins, werden von externen Entwicklern bereitgestellt und nur zu Informations- und technischen Zugriffszwecken verfügbar gemacht. cTrader Store ist kein Broker und erbringt keine Anlageberatung, persönlichen Empfehlungen oder eine Garantie für zukünftige Performance.


Preis
Seit 25/09/2025
25
Verkäufe
325
Kostenlose Installationen