
Beschreibung
Einführung des verbesserten MACD-Histogramms, das entwickelt wurde, um ein klareres und aufschlussreicheres Handelserlebnis zu bieten.
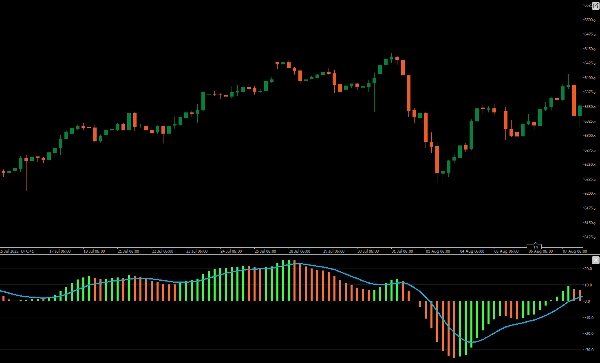
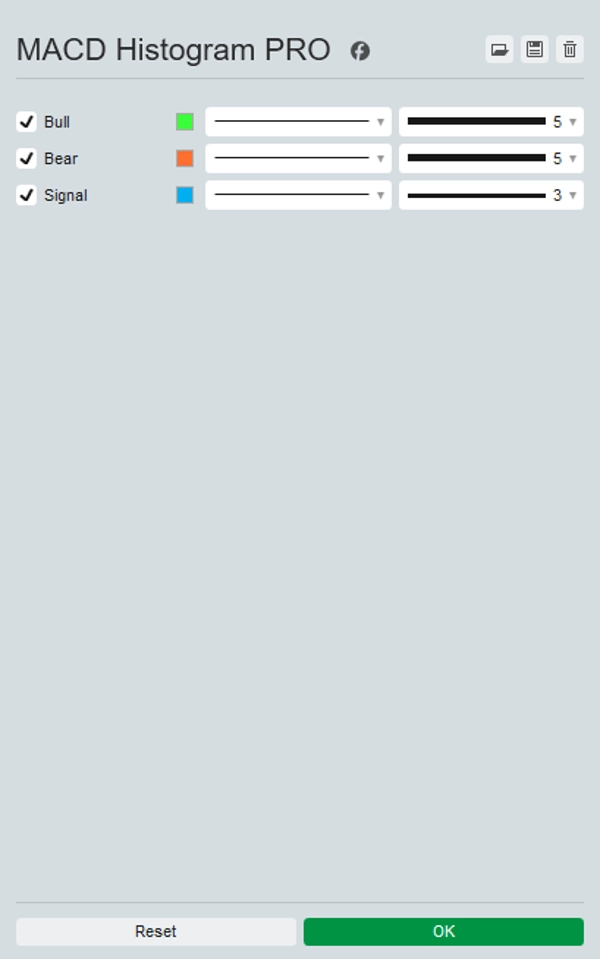
Dieser aufgerüstete Indikator zeigt ein lebendiges, farbiges Histogramm, das zwischen bullischen und bärischen Kursänderungen unterscheidet und über das standardmäßige Einzelfarbschema hinausgeht. Durch die Verwendung unterschiedlicher Farben für positive und negative Bewegungen bietet er einen sofortigen visuellen Hinweis auf die Marktbedingungen, was die Interpretation von Momentumwechseln und potenziellen Trendwenden erleichtert.
Perfekt für Trader, die nach verbesserter Klarheit und Präzision suchen, verwandelt dieses MACD-Histogramm-Upgrade Ihr Chart in ein leistungsfähigeres Analysewerkzeug. Verbessern Sie Ihre Handelsstrategie mit dem verbesserten MACD-Histogramm.
Zusammenfassung
Kundenbewertungen
5 | 50 % | |
4 | 50 % | |
3 | 0 % | |
2 | 0 % | |
1 | 0 % |


